Memory Allocation in Go
Contents
- Introduction
- Go’s View of Virtual Memory
- Heap Management
- Heap Allocation
- Stack Management
- Stack or Heap?
- Case Studies
Disclaimer
This blog post primarily focuses on Go 1.24 programming language running on Linux on ARM architecture. It may not cover platform-specific details for other operating systems or hardware architectures.
The content is based on other sources and my own understanding of Go, so it might not be entirely accurate. Feel free to correct me or give suggestions in the comment section at the very bottom 😄.
Introduction
Memory allocation is at the heart of every programming language runtime, and Go is no exception.
Efficient allocation and management of memory directly affect the performance, scalability, and responsiveness of Go applications.
While Go abstracts away most of the complexity through its simple APIs (new(T), &T{} and make), understanding what happens under the hood gives us valuable insight into how the runtime achieves efficiency, and where potential bottlenecks may arise.
In this post, we’ll explore Go’s memory allocator in depth. We’ll look at its core components, how they interact to serve allocations of different sizes, and how stacks are managed alongside heap objects. Along the way, we’ll examine some case studies to understand the practical implications of Go’s memory allocation strategies. By the end, you should have a clearer picture of how Go abstracts memory management while offers high performance.
Before diving into how Go allocates memory, it’s essential to understand some fundamental concepts about how memory works in a typical operating system. I suggest you read the Fundamental of Virtual Memory post first. If you are already familiar with those concepts, just skip that post. Now, let’s dive into Go’s view of virtual memory.
Go’s View of Virtual Memory
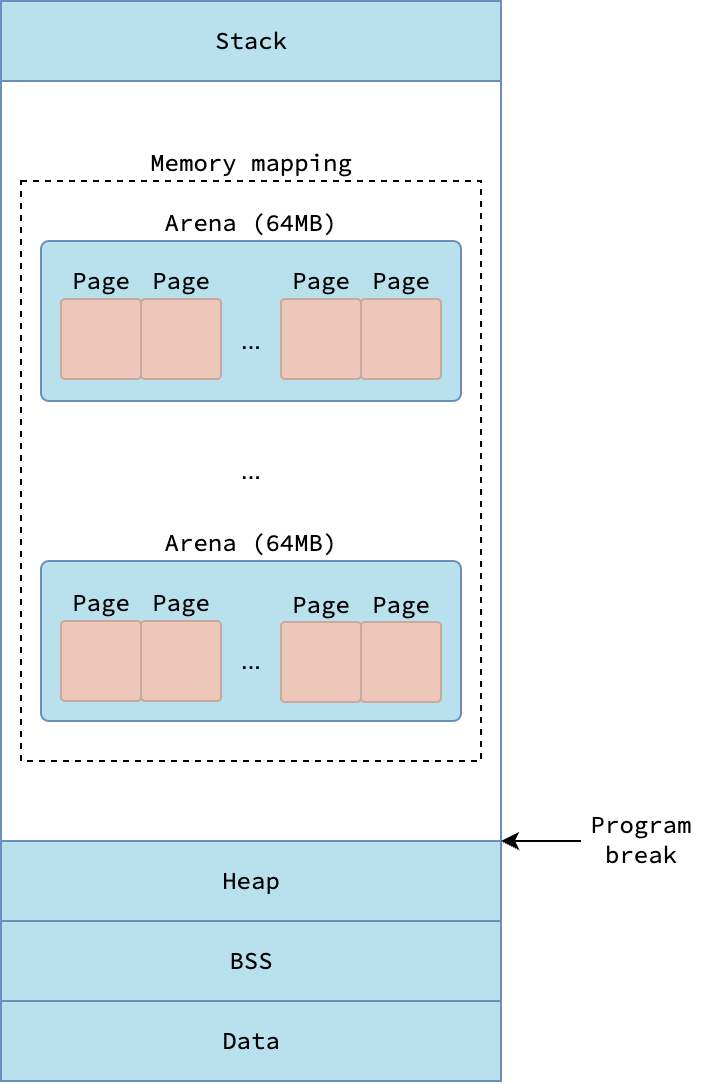
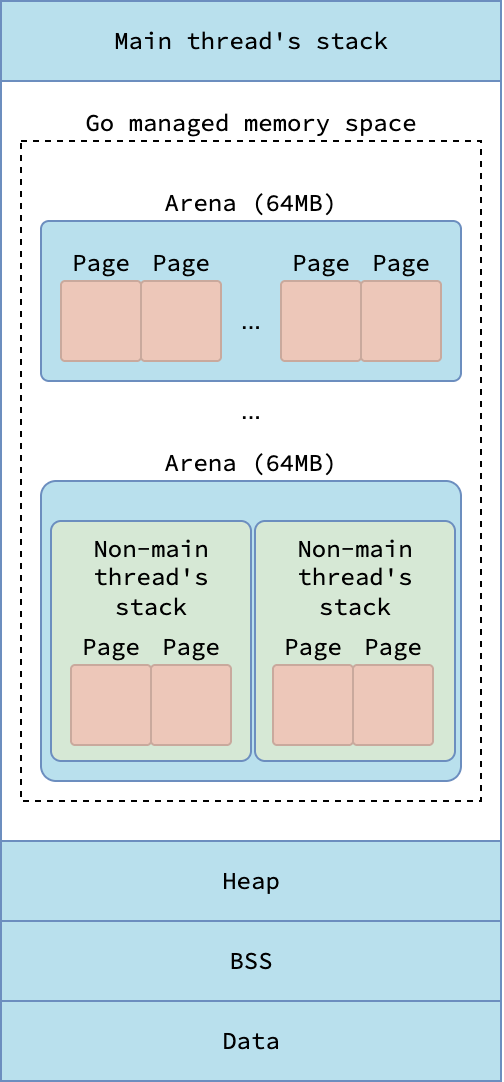
As a Go process is simply a user-space application, it follows the standard virtual memory layout described in the fundamental post.
Specifically, the Stack segment of the process is the g0 stack (aka. system stack) associated with the main thread m0 of the Go runtime.
Initialized (i.e. having non-zero value) global variables are stored in the Data segment, while uninitialized ones reside in the BSS segment.
The traditional Heap segment, which is located under the program break, is not utilized by the Go runtime to allocate heap objects. Instead, Go runtime relies heavily on memory-mapped segments for allocating memory for heap objects and goroutine stacks. From now on, I’ll refer to that memory-mapped segments Go uses for dynamic allocation as the heap, which not to be confused with the traditional process heap under the program break.
 |
|---|
| Virtual memory layout from Go runtime’s perspective |
Arena and Page
To manage this memory efficiently, Go runtime partitions these memory-mapped segments into hierarchical units, ranging from coarse-grained to fine-grained.
The most coarse-grained units are known as an arenas, a fixed-size region of 64 MB.
Go runtime tries to make arenas contiguous, but they are not necessarily so due to the behavior of mmap system call, which may return a different address than requested.
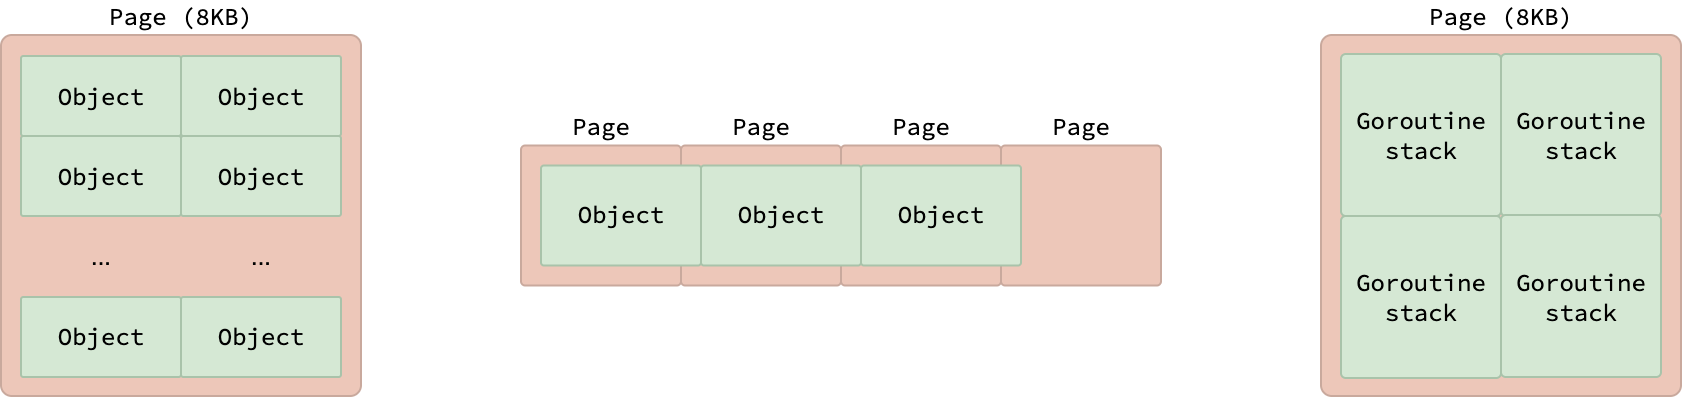
Each arena is further subdivided into smaller fixed-size units called pages, each measuring 8 KB. It’s important to note that these runtime-managed pages differ from the typical OS pages discussed in the fundamental post, which are commonly 4 KB in size. Each page holds multiple objects of the same size if the objects are smaller than 8 KB, or just a single object if the size is exactly 8 KB. Objects larger than 8 KB stretch over multiple pages.
 |
|---|
| Memory pages in Go runtime |
These pages are also utilized for the allocation of goroutine stack. As discussed previously in my Go Scheduler blog post, each goroutine stack initially occupies 2 KB, meaning a single 8 KB page can house up to 4 goroutine stacks.
Span and Size Class
Another key concept in Go’s memory management is the span. A span is a unit of memory consisting of one or more contiguous pages allocated together. Each span is subdivided into multiple objects of the same size. By partitioning a span into multiple equal object, Go effectively uses segregated fit memory allocation strategy. This strategy allows Go to efficiently allocate memory for objects of various sizes while minimizing fragmentation.
Go uses the mspan struct to hold metadata about a span, such as the starting address of the first page, the number of pages it spans, the number of allocated objects, and more.
In this blog, when I refer to a span, I mean the memory region it represents.
When I refer to an mspan, I mean the struct that describes that region.
The Go runtime organizes object sizes into a set of predefined groups called size classes. Every span belongs to exactly one size class, determined by the size of objects it contains. Go defines 68 distinct size classes, numbered from 0 to 67, as shown in this size class table. Size class 0 is reserved to handle allocation for large objects, which is larger than 32 KB, while size class 1 to 67 are used for tiny objects and small objects.
 |
|---|
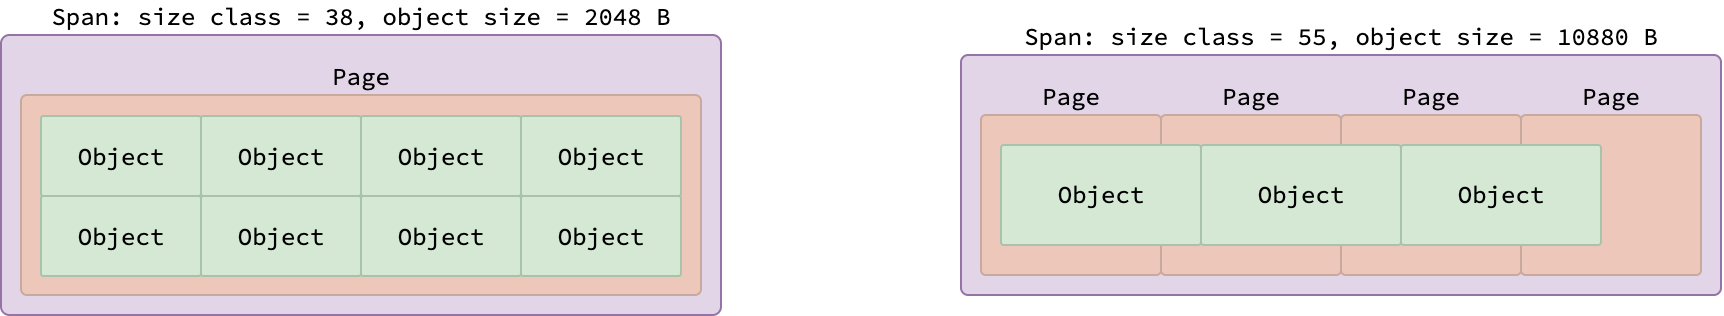
| Two spans with different size classes |
Spans belonging to some size class contain a fixed number of pages and objects, determined by the bytes/span and objects columns in the table.
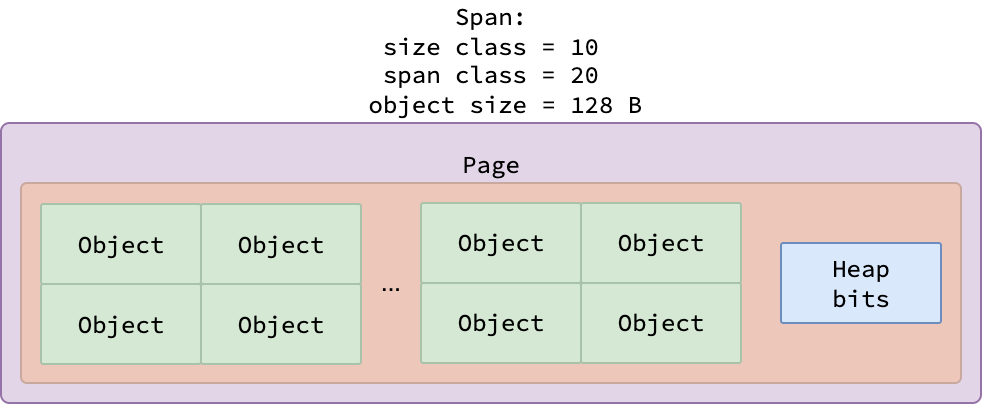
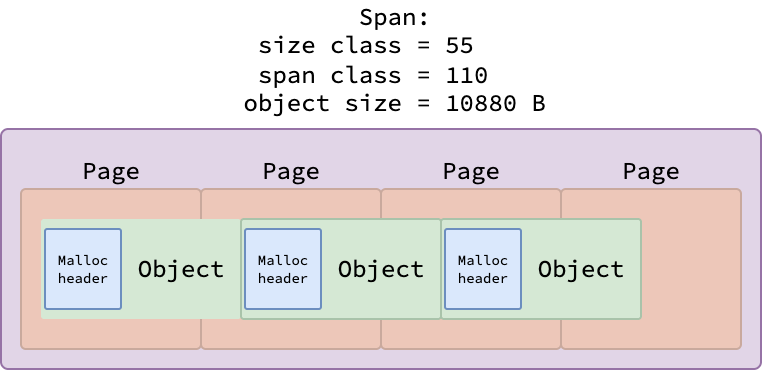
The figure above illustrates two spans: one from size class 38 (holding 2048-byte objects) and another from size class 55 (holding 10880-byte objects).
Because a single 8 KB page fits exactly four 2048-byte objects, the span for size class 38 contains 4 objects within a single page.
Conversely, since each 10880-byte object exceeds one page, the span for size class 55 spans 4 pages, accommodating 3 objects.
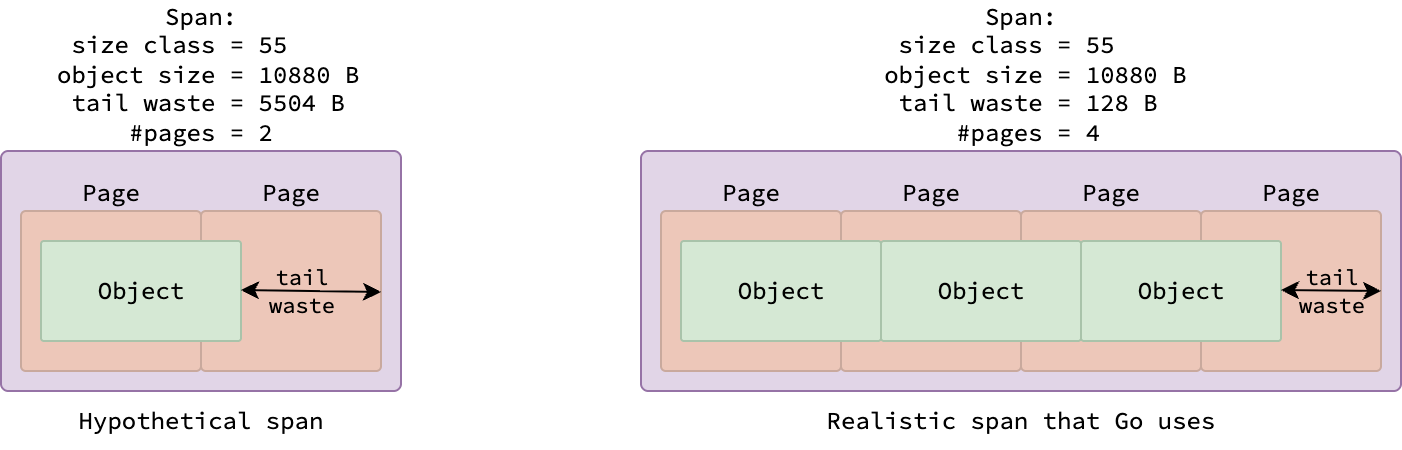
But why doesn’t a span of size class 55 contain only one object and stretch over 2 pages, as described in the below figure?
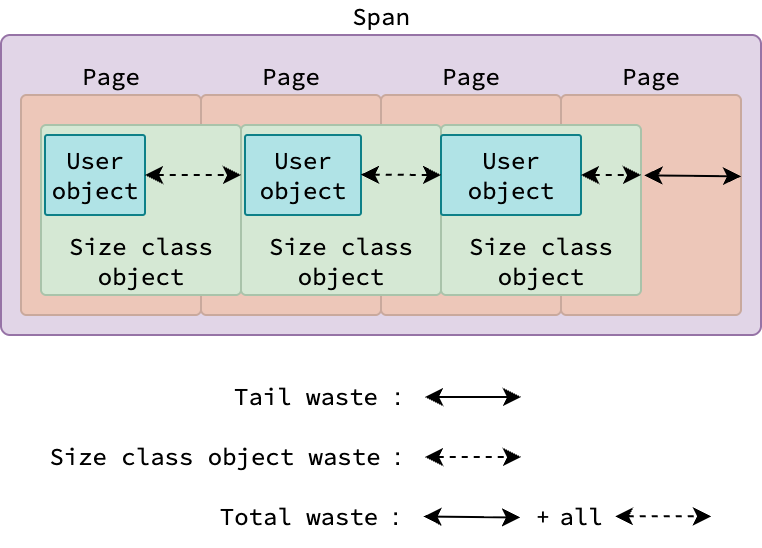
The reason is to reduce memory fragmentation. Since objects within a span are contiguous, there could be a space between the last object and the end of the span.
This space is called tail waste, and can be easily determined by the formula (number of pages)*8192-(number of objects)*(object size).
If the span were allocated across 2 pages, the tail waste would be 2*8192-10880*1=5504 bytes, significantly higher than the 4*8192-10880*3=128 bytes of tail waste when allocated across 4 pages.
 |
|---|
| Tail waste in span |
While a user Go application can allocate objects of various sizes, why does Go have only 67 size classes for small objects? What if our application allocates a small object of size 300 bytes, which doesn’t have a corresponding entry in ths size classes table? In such case, Go runtime will round up the size of the object to the next size class, which is 320 bytes in this case. The green object illustrated so far is not an actual object allocated by user Go application, but rather a size class object managed by the Go runtime.
 |
|---|
| User objects and size class objects |
Objects allocated by user Go application (abbreviated by user objects) are contained within a size class object. User objects can vary in size, but they must be smaller than the size of the size class object that they belong to. Because of this, there could be a waste between the size of the user object and the size of the size class object. These wastes in all size class objects together with the tail waste constitutes the total waste of the span.
⚠️ A size class object does not always contain exactly one user object. For small & large user objects, each size class object typically holds exactly one user object. For tiny user objects, however, multiple user objects can be packed into a single size class object, see Tiny Objects Allocator.
Let’s consider a span of size class 55 in the worst-case scenario, where it holds three user objects, each with a size of 10241 bytes, i.e. the minimum size for objects of size class 55.
The waste of 3 size class objects is 3*(10880-10241)=3*639=1917 bytes, and the tail waste is 4*8192-10880*3=128 bytes.
Therefore, the total waste of this span is 1917+128=2045 bytes, while the span size is 4*8192=32768 bytes, resulting in the maximum total waste of 2045/32768=6.24%, as described in the 6th column of the size class 55 in Go’s size class table.
Despite the fact that Go uses segregated fit strategy, which is designed to minimize fragmentation, there is still some waste in the memory. The total waste of a span reflects how much memory is externally fragmented per span.
Span Class
Go’s garbage collector is a tracing garbage collector, which means it needs to traverse the object graph to identify all reachable objects during a collection cycle. However, if a type is known to contain no pointers neither directly nor through its fields, e.g. a struct that has multiple fields and some of the fields contain pointer to primitive types or pointer to another struct, then the garbage collector can safely skip scanning objects of that type to reduce overhead and improve performance, right? The presence or absence of pointers in a type is determined at compile time, so this optimization comes with no additional runtime cost.
To facilitate this behavior, the Go runtime introduces the concept of a span class. A span class categorizes memory spans based on two properties: the size class of the objects they contain and whether those objects include pointers. If the objects contain pointers, the span belongs to the scan class. If they don’t, it’s classified as a noscan class.
Because pointer presence is a binary property—either a type contains pointers or it doesn’t—the total number of span classes is simply twice the number of size classes.
Go defines 68*2=136 span classes in total. A span class is represented by an integer, ranging from 0 to 135.
If the number is even, it is a scan class; noscan class otherwise.
Previously, I mentioned that every span belongs to exactly one size class. More accurately, however, every span belongs to exactly one span class. The associated size class can be derived by dividing the span class number by 2. Whether the span belongs to scan or noscan class is determined by the parity of the span class number: even numbers indicate scan spans, while odd numbers indicate noscan spans.
Span Set
In order to manage spans efficiently, Go runtime organizes them into a data structure called span set.
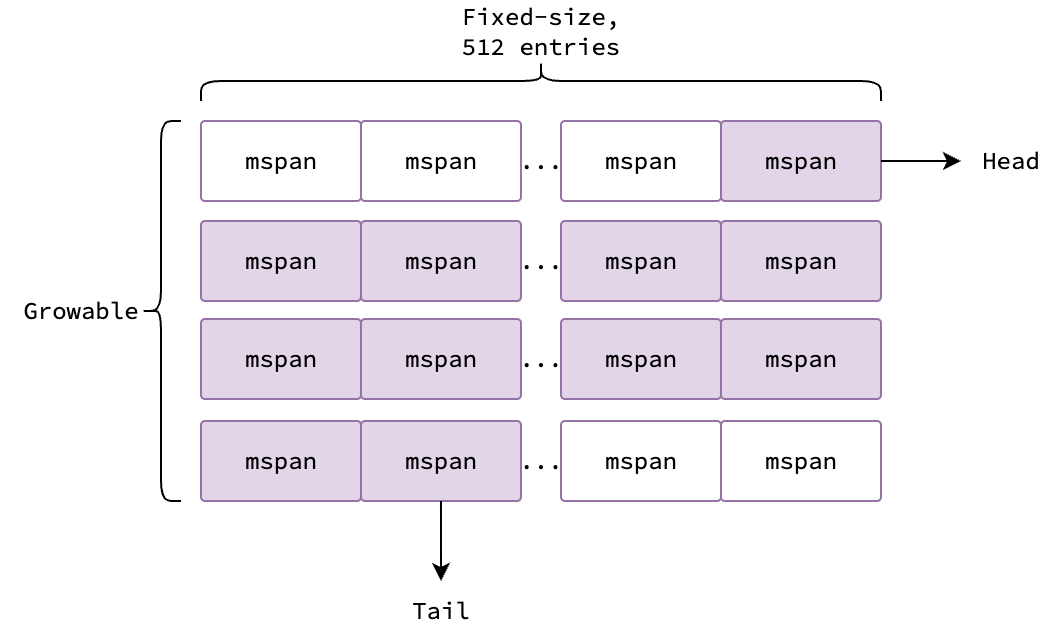
A span set is a collection of mspan objects that belong to the same span class, illustrated in the figure below.
 |
|---|
| Layout of a span set |
In essence, it’s a slice of arrays.
The slice grows dynamically as needed, and the size of each array is fixed at 512 entries.
Each element in the array is a mspan object which holds metadata for the span, and thus can be null.
The purple elements in the figure above are non-null, while the white elements are null.
A span set also have two additional fields: head and tail, which are used to track the first and last non-null elements in the span set.
Popping from the span set begins at head, traversing arrays top-down and within each from left to right.
Pushing begins at tail, likewise traversing top-down, filling each array from left to right.
In case pushing or popping elements result in an empty array, the array is removed from the span set and added to a pool of free arrays for future reuse.
Note that head and tail are atomic variables, therefore adding or removing spans from the span set can be done concurrently by multiple goroutines without additional locking.
Heap Bits and Malloc Header
Given a big struct having 1000 fields, some of the fields are pointers, how does Go’s garbage collector know which fields are pointers so that it can traverse the object graph correctly? If the garbage collector had to inspect every field of every object at runtime, it would be prohibitively inefficient, especially for large or deeply nested data structures. To solve this, Go uses metadata to efficiently identify pointer locations without scanning all fields. This mechanism is based on two key structures: heap bits and malloc headers.
For objects smaller than 512 bytes, Go allocates memory in spans and uses a heap bitmap to track which words in the span contain pointers. Each bit in the bitmap corresponds to a word (typically 8 bytes): 1 indicates a pointer, 0 indicates non-pointer data. The bitmap is stored at the end of the span and shared by all objects in that span. When a span is created, Go reserves space for the bitmap and uses the remaining space to fit as many objects as possible.
 |
|---|
| Heap bits in a span |
For objects larger than 512 bytes, maintaining a big bitmap is inefficient.
Instead, each object is accompanied by an 8-byte malloc header—a pointer to the object’s type information.
This type metadata includes the GCData field, which encodes the pointer layout of the type.
The garbage collector uses this data to precisely and efficiently locate only the fields that contain pointers when traversing the object graph.
 |
|---|
| Malloc header in objects |
Heap Management
Go builds its own heap abstraction on top of memory-mapped segments, managed by the global mheap object.
mheap is responsible for allocating new spans, sweeping unused spans, and even managing goroutine stacks.
Span Allocation: mheap.alloc
Since the Go runtime operates within a vast virtual address space, the mheap allocator can struggle to locate contiguous free pages efficiently when it comes to allocating a span, especially under high concurrency.
In early versions of Go, as detailed in the Scaling the Go Page Allocator proposal, every mheap operation was globally synchronized.
This design caused severe throughput degradation and increased tail latency during heavy allocation workloads.
Today’s Go memory allocator implements the scalable design from that proposal.
Let’s dive into how it overcomes these bottlenecks and manages memory allocation efficiently in highly concurrent environments.
Tracking Free Pages
Because the virtual address space is large, and each page’s state (free or in-use) is a binary property, it is efficient to store this information in a bitmap where 1 represents in-use and 0 represents free.
Note that in-use or free in this context refers to whether the page is owned by a span or not, not whether it is in-use or free by the user Go application.
Each bitmap is an array of 8 uint64 values, taking 64 bytes in total, and can represent the state of 512 contiguous pages.
Given that an arena is 64 MB in size and each page is 8 KB, there are 64MB/8KB=8192 pages in an arena.
Since each bitmap covers 512 pages, an arena requires 8192/512=16 bitmaps.
With each bitmap taking 64 bytes, the total size of all bitmaps for an arena is 16×64=1024 bytes, or 1 KB.
However, iterating through a bitmap to find a run of free pages is still inefficient, and wasteful if the bitmap doesn’t contain any free pages.
It’s better if we somehow cache the free pages so that we can quickly find a free page without scanning the bitmap.
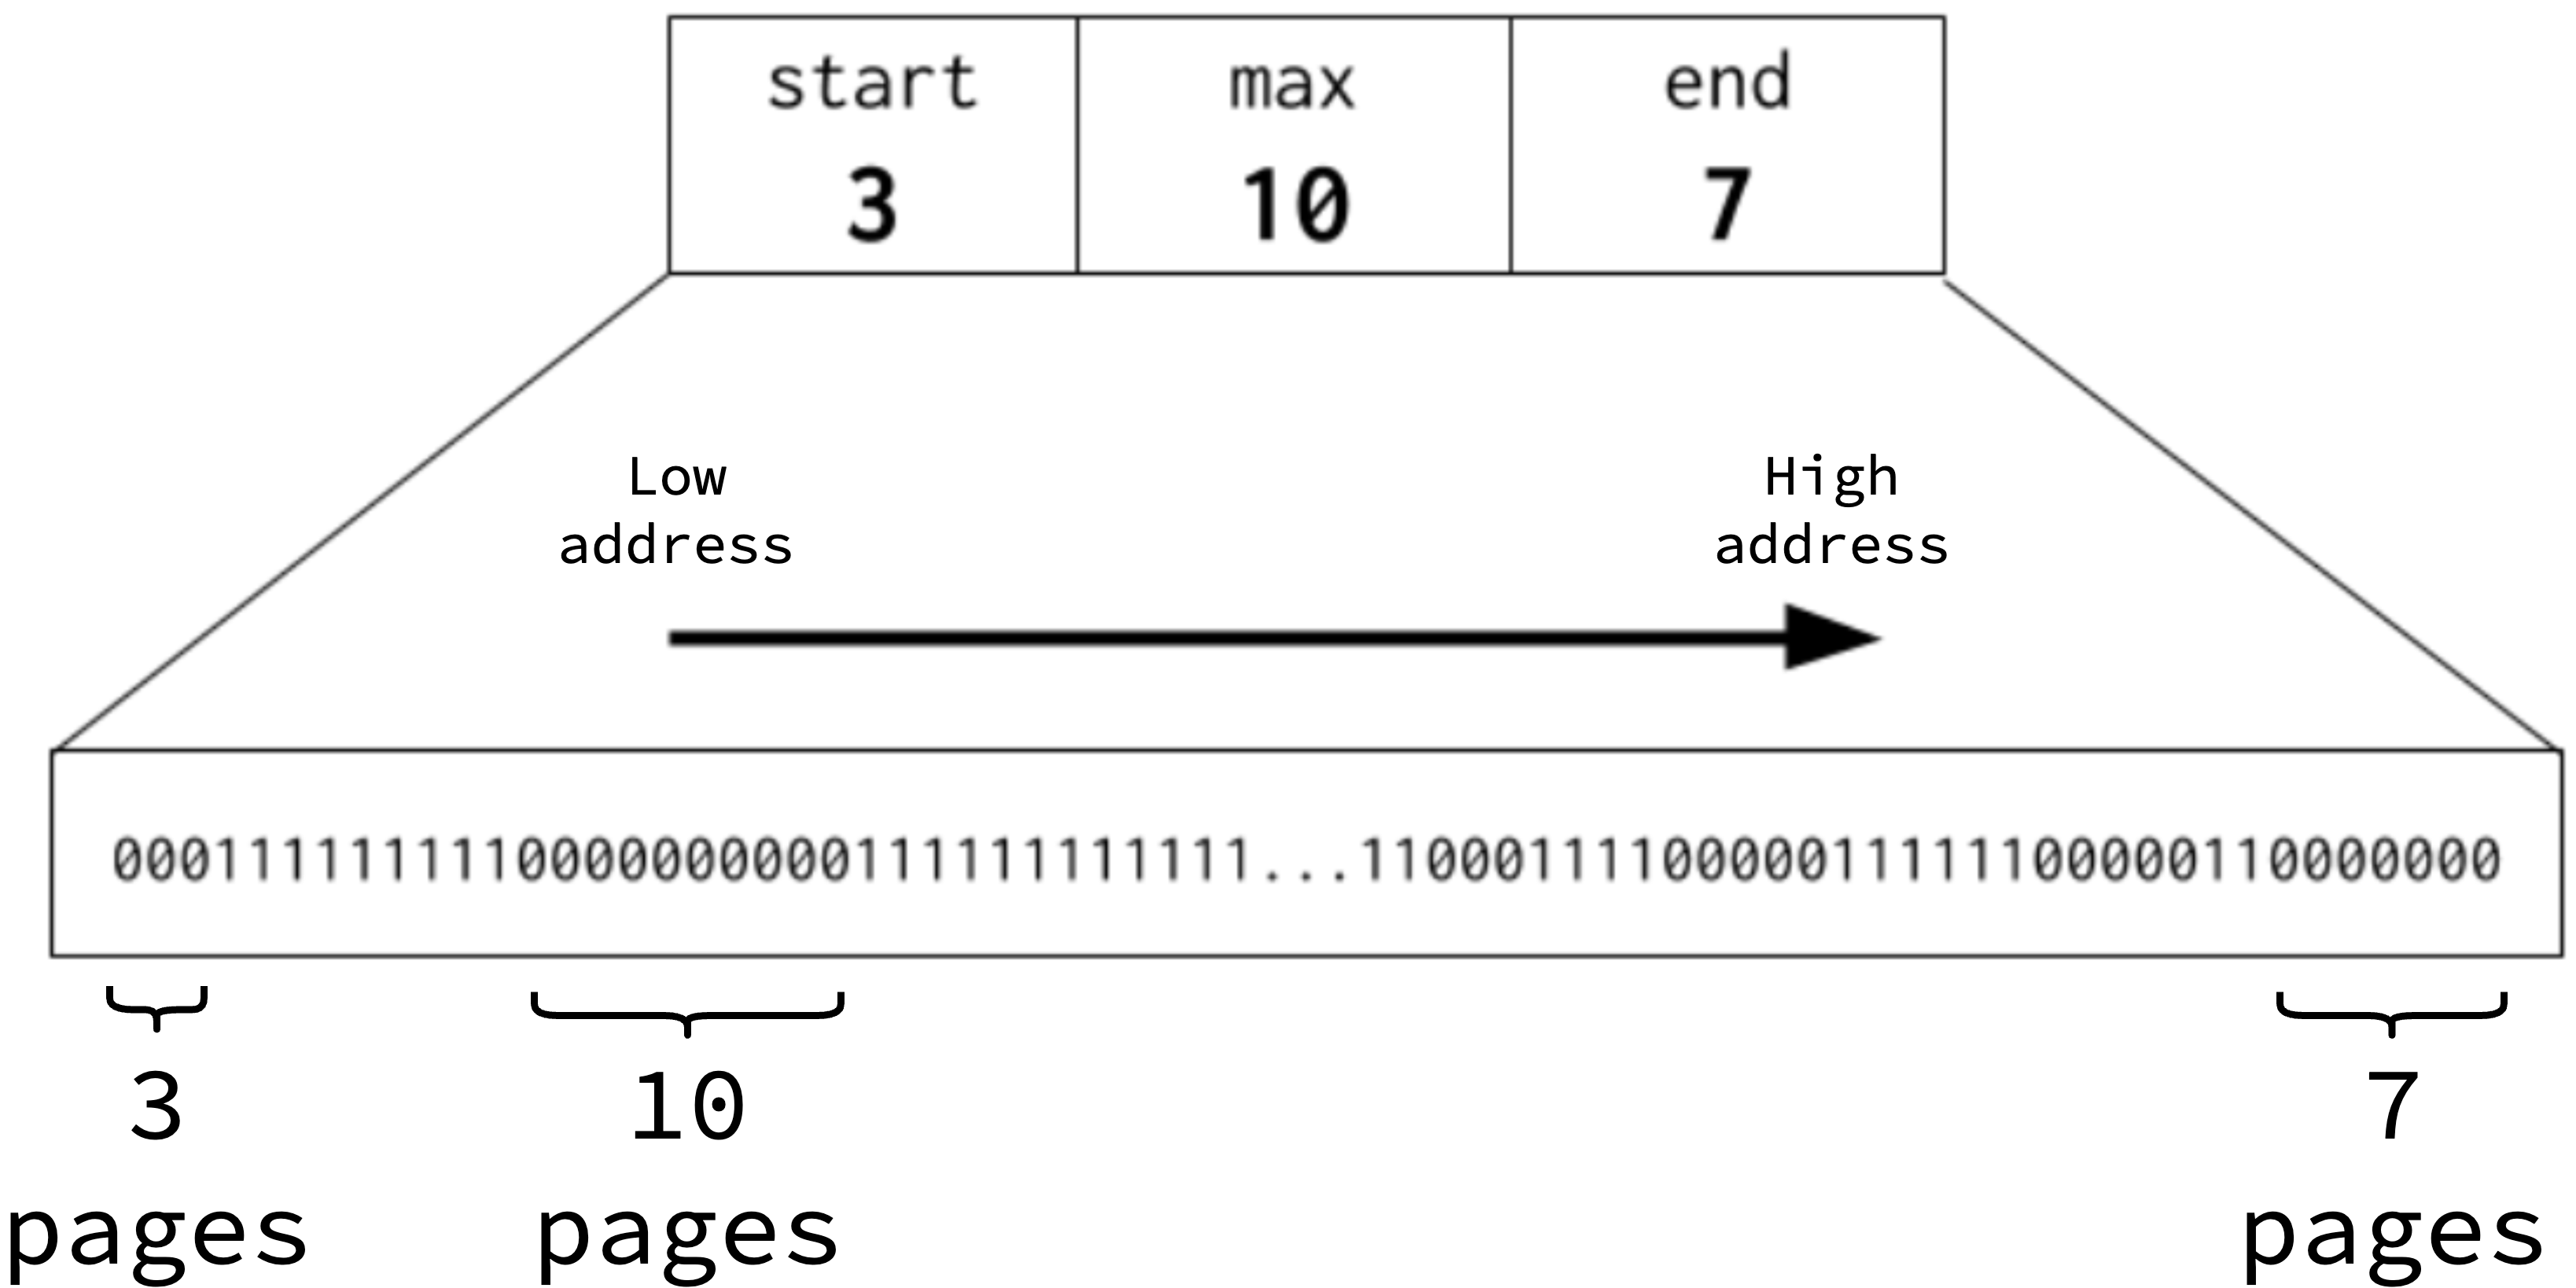
Go introduces the concept of summary for a bitmap, which has three fields: start, end, and max.
start is the number of contiguous 0 bits at the beginning of a bitmap.
Similarly, end is the number of contiguous 0 bits at the end of the bitmap.
Finally, max represents the largest contiguous sequence of 0 bits.
The summaries are updated eagerly as soon as the bitmap is modified, i.e. when a page is allocated or freed.
The figure below shows a bitmap summary: there are 3 contiguous free pages at the beginning, 7 contiguous free pages at the end, and the longest run of free pages is 10. The arrow indicates the growth direction in address space, i.e. 3 free pages at the lower address and 7 free pages at the higher address.
 |
|---|
| Visualization of a bitmap summary |
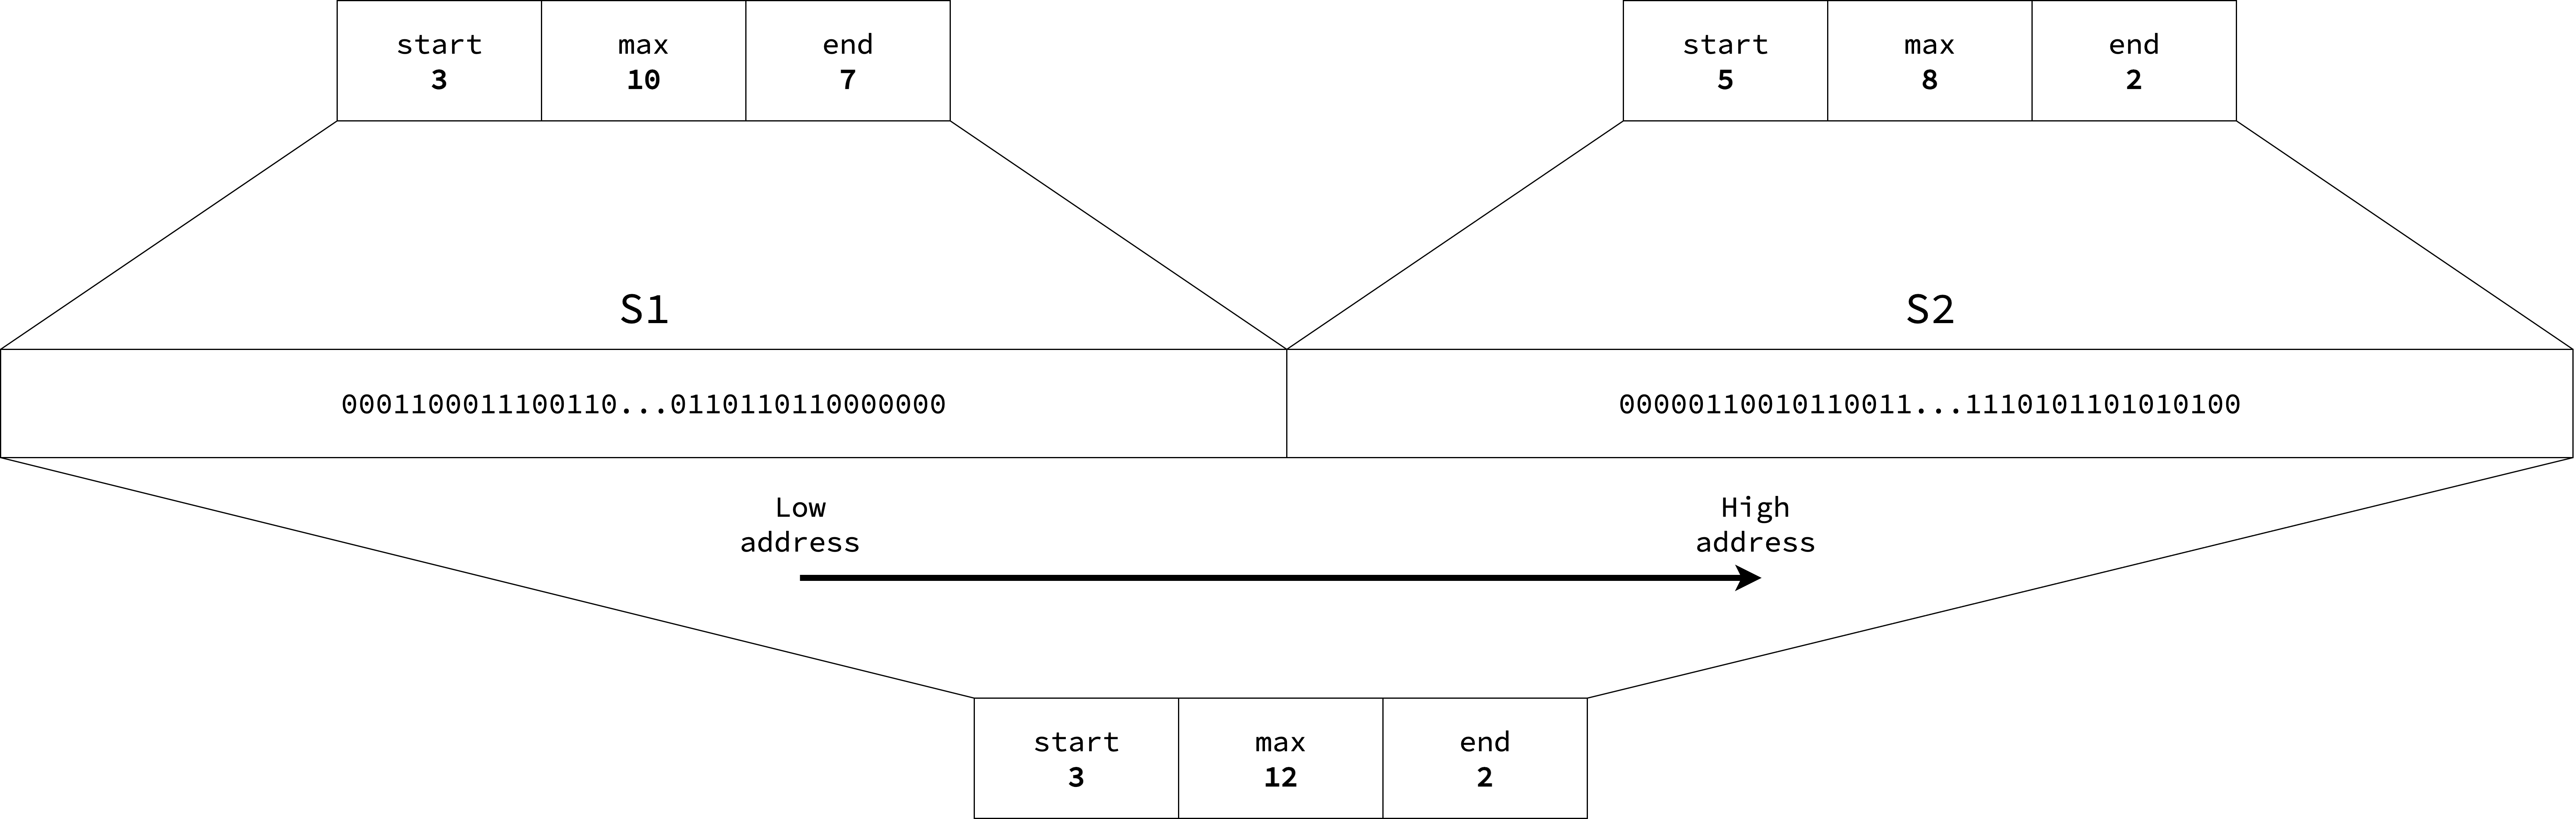
With these three fields, Go is able to find a sufficient contiguous free chunk of memory within a single arena or across multiple adjacent arenas by merging the summaries of contiguous memory chunks.
Consider two adjacent chunks, S1 and S2, each spanning 512 pages.
The summary of S1 is start=3, end=7, and max=10, while the summary of S2 is start=5, end=2, and max=8.
Since these chunks are contiguous, they can be merged into a single summary covering all 1024 pages.
The merged one is computed as start=S1.start=3, end=S2.end=2, max=max(S1.max, S2.max, S1.end+S2.start)=max(10, 8, 7+5)=12.
 |
|---|
| Merging summaries of two contiguous memory chunks |
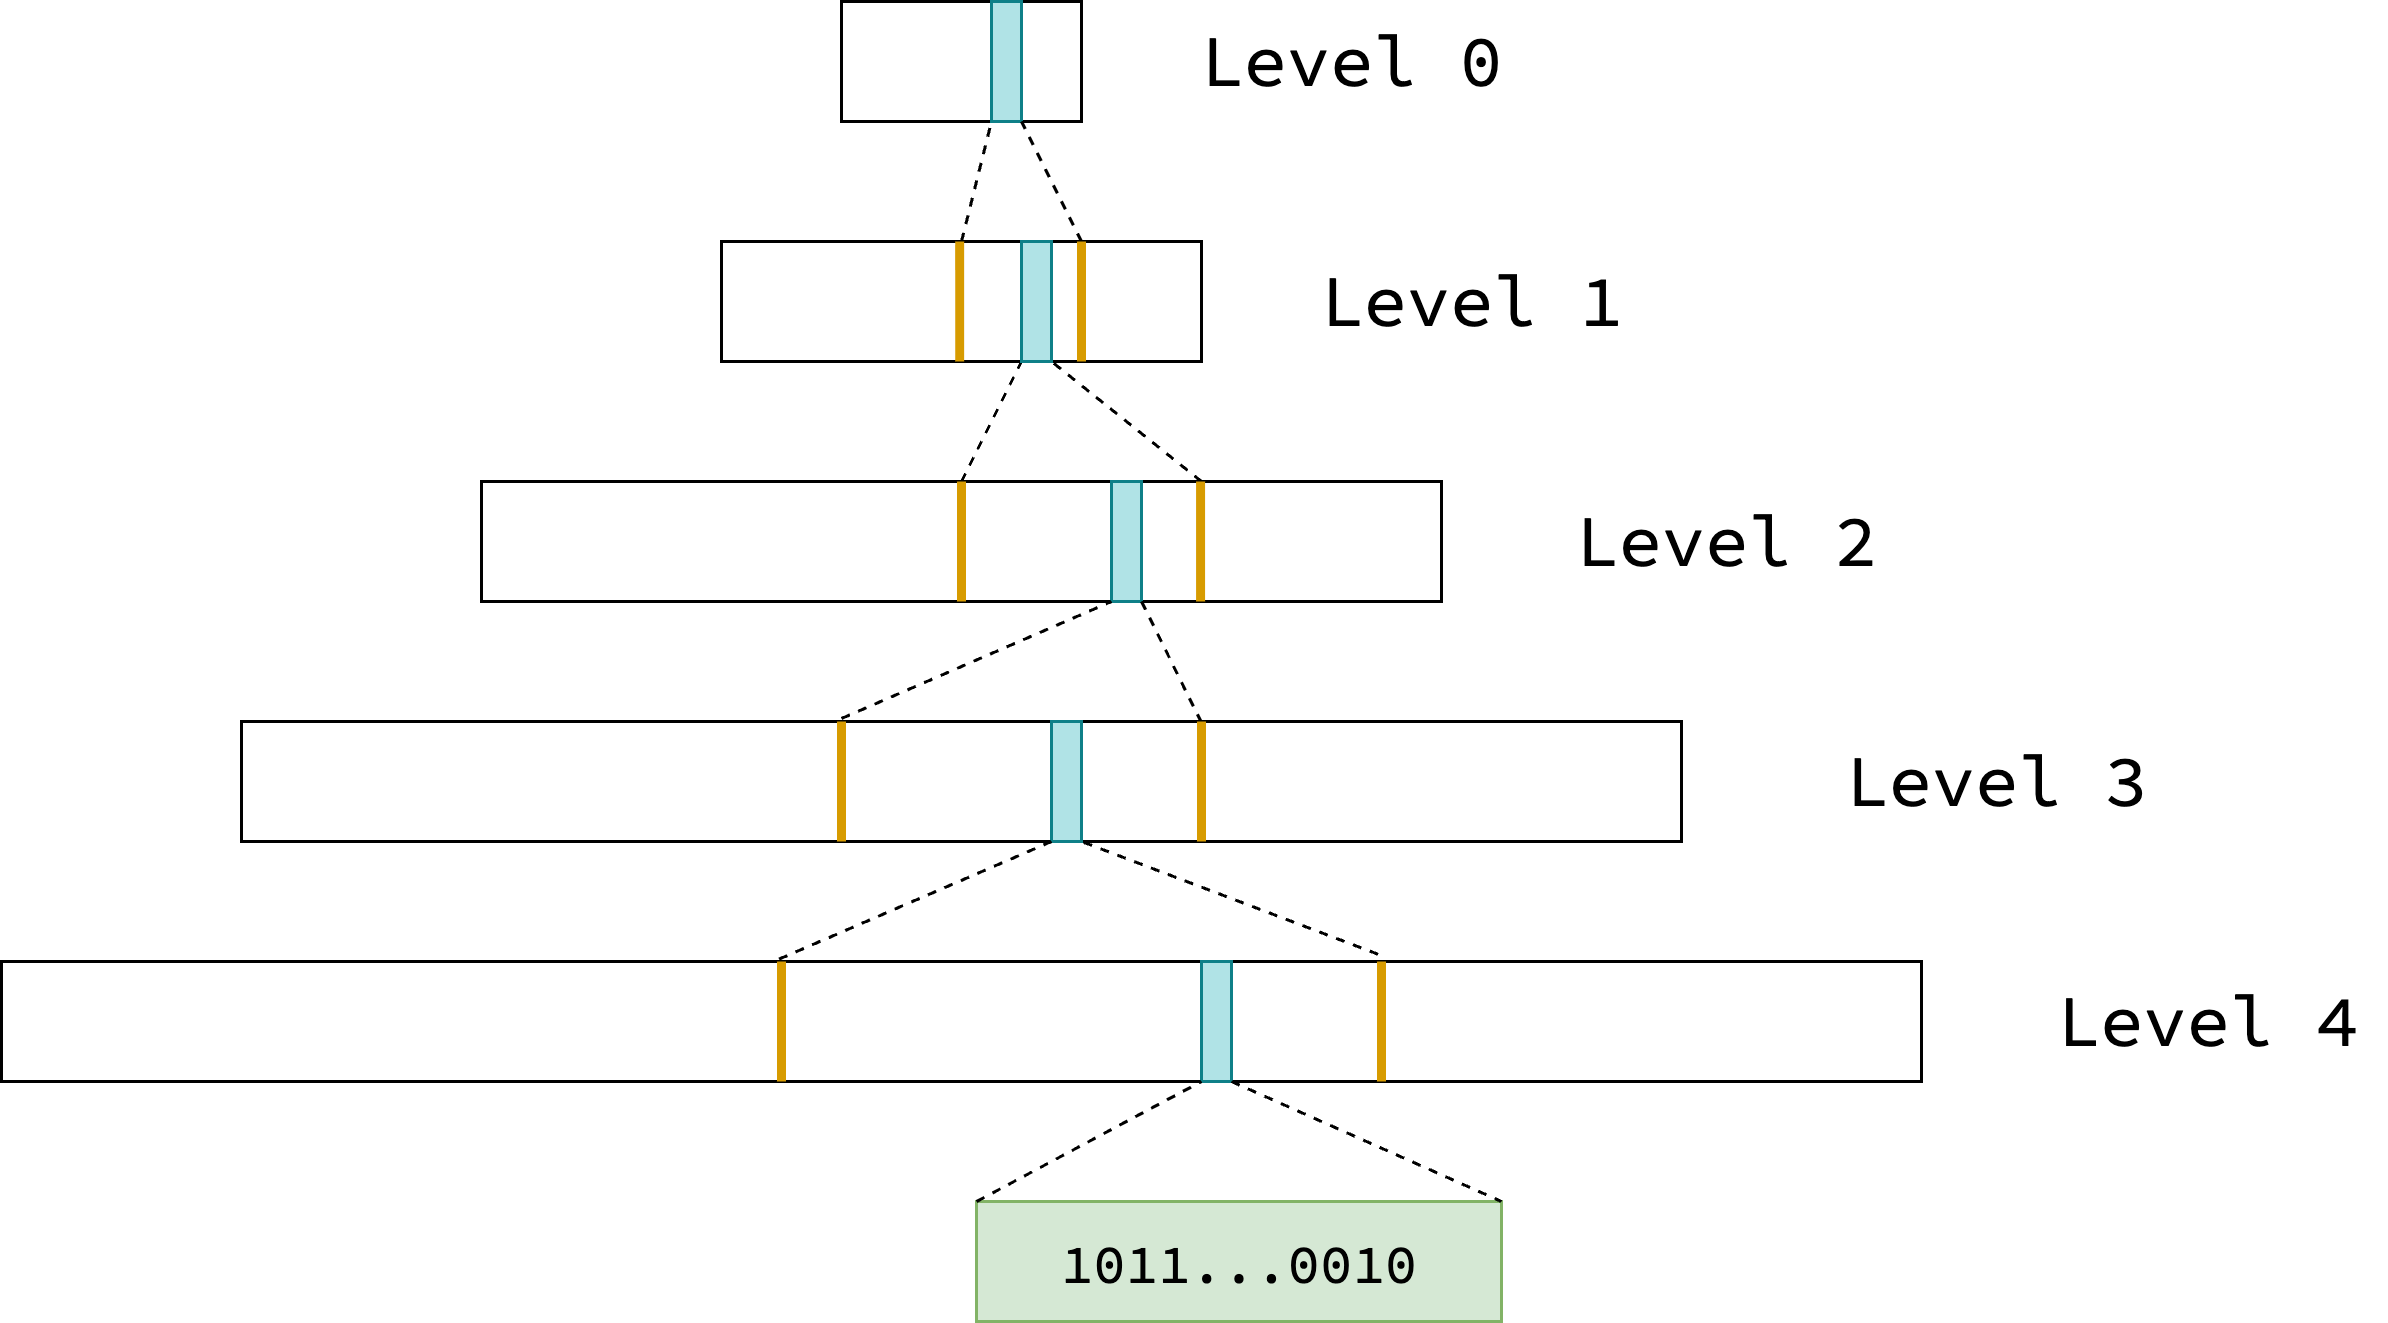
By merging lower-level summaries, Go implicitly builds a hierarchical structure that enables efficient tracking of contiguous free pages. It manages the entire virtual address space using a single global radix tree of summaries as depicted in the figure below. Each blue box represents a summary for a contiguous memory chunk and its dotted lines to the next level reflects what portion in the next level it covers. The green box represents the bitmap of 512 pages that a leaf node summary refers to.
 |
|---|
| Radix tree of summaries for the entire address space |
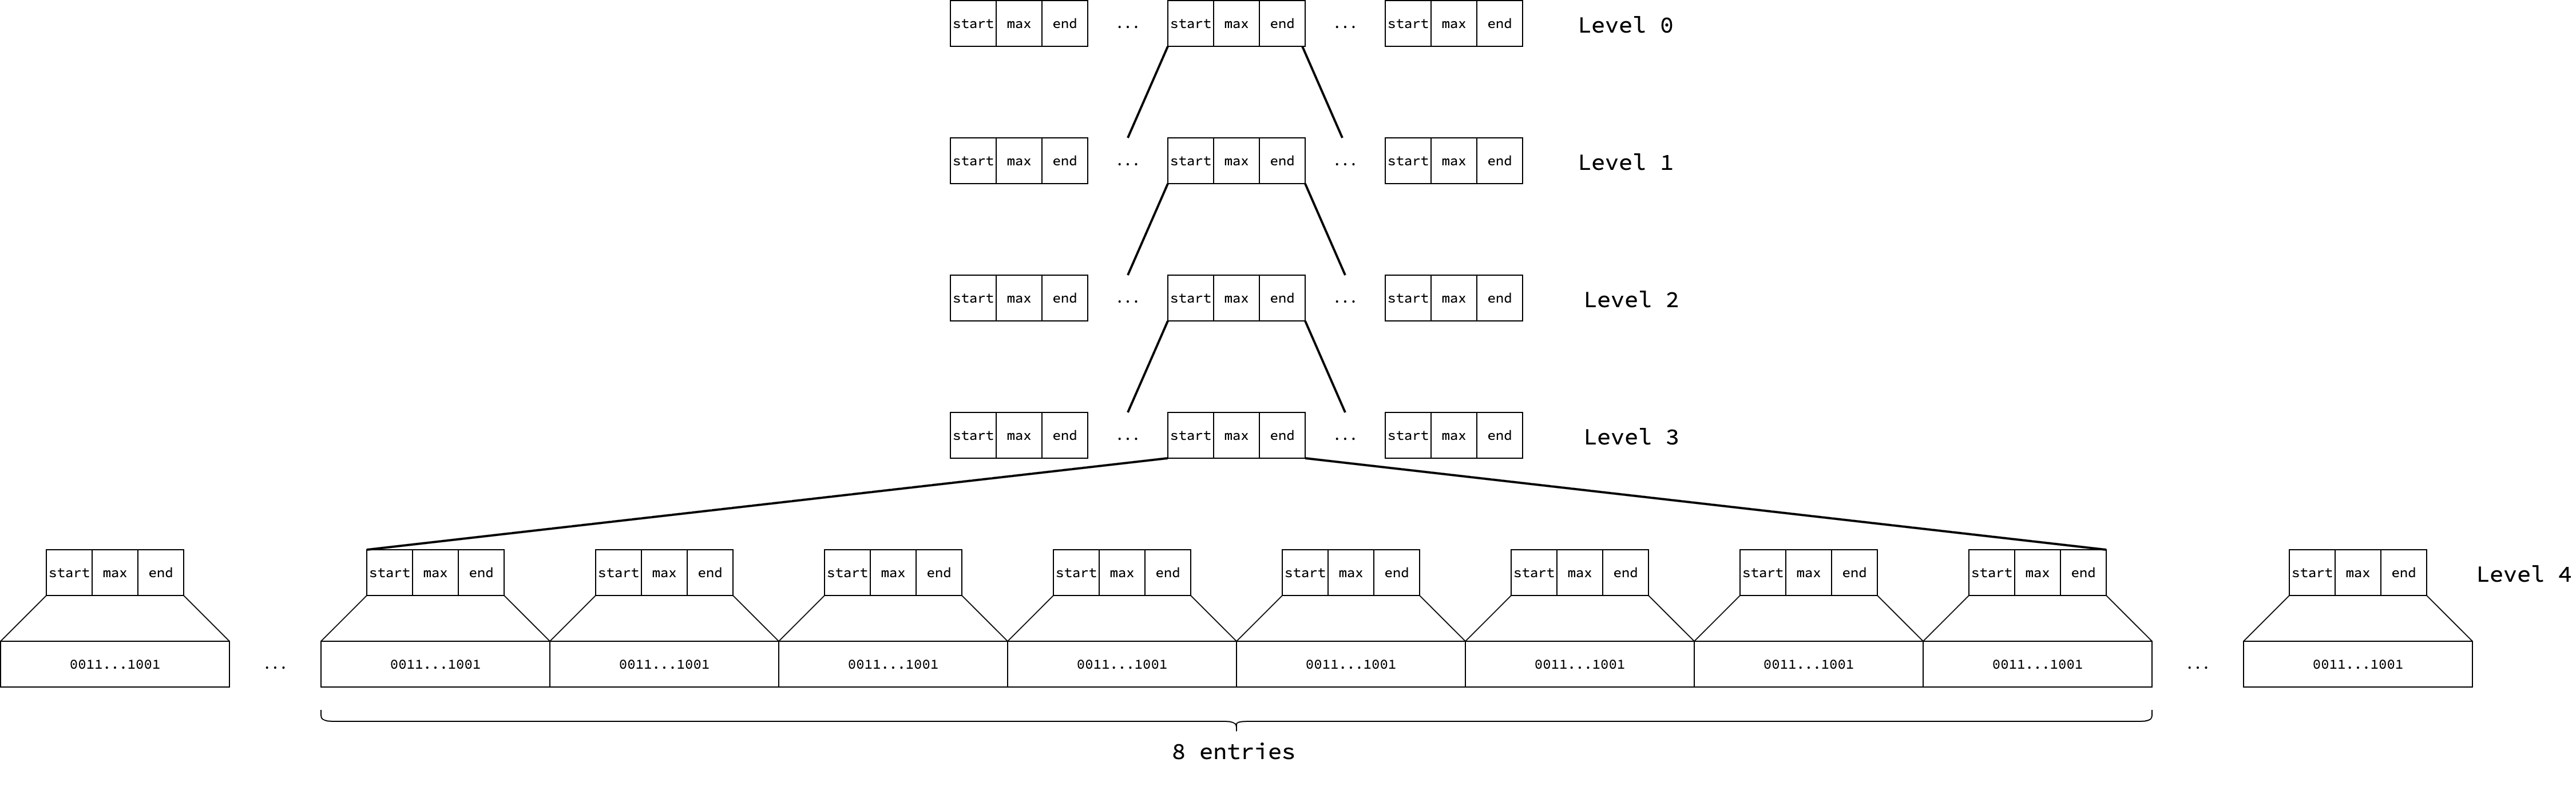
On linux/amd64 architecture, Go uses a 48-bit virtual address space, which is 2^48 bytes or 256 TB.
In this setup, the radix tree has a height of 5.
Internal nodes (levels 0 to 3) store summaries derived from merging their 8 child nodes.
Each leaf node (level 4) corresponds to the summary of a single bitmap, which covers 512 pages.
There are 16384 entries at level 0, 16384*8 entries at level 1, 16384*8^2 entries at level 2, 16384*8^3 entries at level 3, and 16384*8^4 entries at level 4.
Because each leaf entry summarizes 512 pages, each level 0 entry summarizes 512*8^4=2097152 contiguous pages, which accommodates 2097152*8KB=16GB amount of memory.
Note that these numbers represent the maximum possible entries. The actual number of entries at each level increases gradually as the heap grows.
 |
|---|
| A deeper look into the summary radix tree |
As mentioned earlier, each level 0 entry summaries 209715=2^21 contiguous pages, start, end, and max can be as big as 2^21.
As a result, storing all these three fields together requires up to 21*3=63 bits.
This makes it possible to pack a summary into a single uint64 called pallocSum: the first 21 bits store start, the next 21 bits store end, and the following 21 bits store max.
There is one special case: if max=2^21, it means the entire chunk is free.
In this situation, start and end are also 2^21, and the summary is encoded as 2^63.
Conversely, if the chunk has no free page, i.e. all start, end and max are 0, the summary value is definitely 0.
The summary radix tree is implemented as an array of slices, where each slice corresponds to a tree level. The array fixes the number of levels in the tree, while the slices grow dynamically as the heap expands. Summaries for the lower address stays at the beginning of the slice, while summaries for the higher address are appended to the end of the slice. Since the summary slice at a given level covers the entire reserved address space, the index of a summary within its slice directly determines the memory region it represents.
Finding Free Pages: pageAlloc.find
Go uses depth-first search algorithm locate a sufficient run of free pages. It begins with scanning up to 16,384 entries at level 0 of the radix tree. If a summary is 0 (meaning no free pages), it moves on to the next entry.
If a sufficient run is found at the boundary between two adjacent entries, or at the start of the first entry, or at the end of the last entry, then it returns the address of the free run immediately, based on the address the summary refers to.
Otherwise, if current summary’s max field satisfies the allocation request, the search descends into its 8 child entries at the next level.
If the search reaches the leaf level but still can’t find a sufficient run, then it scans the bitmap within the entry whose max value is large enough, in order to locate the exact run of free pages.
If we traverse all entries at level 0 but still can’t find a sufficient run, it returns 0, indicating no free pages.
You may notice a drawback in this algorithm: if many pages at the beginning of level 0 are already in use, the allocator ends up traversing the same path in the radix tree repeatedly for each allocation, which is inefficient.
Go addresses this by maintaining a hint called searchAddr, which marks an address before which no free pages exist.
This allows the allocator to begin its search directly from the hint instead of restarting from the beginning.
Since allocations proceed from lower to higher addresses in the heap, the hint can be advanced after each search, shrinking the search space until new memory is freed. In practice, most allocations occur close to the current hint.
Growing the Heap: mheap.grow
If no free pages are available in the radix tree, i.e. pageAlloc.find returns 0, Go runtime must ask the kernel to expand its virtual address space by making an mmap system call.
The growth may not be as big as the number of pages requested, but instead occurs in larger chunks rounded up to the arena size (64 MB).
Even if only a single page is requested, the heap expands by 64 MB in virtual memory space (not physical, thanks to demand paging!).
To manage this, the runtime maintains a list of hint addresses called arenaHints, which are addresses it prefers the kernel to use for new allocations.
This list is initialized before the main function runs, and its values can be found here.
During heap growth, Go iterates through these hints, asking the kernel to allocate memory at each suggested address by passing that address to the first parameter of mmap system call.
The kernel, however, may choose a different location. If that happens, Go moves on to the next hint. If all hints fail, Go falls back to requesting memory at a random address aligned to the arena size, and then updates the hint list so that the future growth stays contiguous with the newly allocated arena.
This process transitions the memory section from None to Reserved. Once the arena is registered with the runtime, i.e. by being added to the list of all arenas, the section transitions from Reserved to Prepared. At this point, the radix summary tree is updated to include the new arena, expanding the summary slices at each level, marking the bitmap for new pages as free, and update the summaries accordingly. This new memory section is also tracked as in-use.
Setting up a Span: mheap.haveSpan
Once the requested run of pages is found, the runtime sets up an mspan object to manage that memory range.
Like any other Go object, an mspan object itself must live in memory.
Thus, these mspan objects are allocated by a fixalloc slab allocator, which requests memory directly from the kernel using mmap system call.
The span is then set up with its size class, the number of pages it covers, and the address of its first page.
The associated memory section transitions from Prepared to Ready, indicating that it’s ready for mcentral to use.
Caching Free Pages: mheap.allocToCache
Unfortunately, both pageAlloc.find and mheap.grow rely on global locks, which can become bottlenecks under heavy concurrent allocation workloads.
Since a Go program runs as concurrent as the number of processor Ps, caching free pages locally in each P helps avoid global lock contention.
Go implements this with a per-P pageCache.
A pageCache consists of a base address for a 64-page-aligned memory chunk and a 64-bit bitmap tracking which of those pages are free.
Because each page is 8 KB, a single P’s pageCache can hold up to 512 KB of free memory.
When a goroutine requests a span from mheap, the runtime first checks the pageCache of the current P.
If it contains enough free pages, those pages are used immediately to set up a span.
If not, the runtime falls back to invoking pageAlloc.find to locate a sufficient run of pages.
If the pageCache is empty, the runtime allocates a new one.
It first tries to obtain pages near the current hint searchAddr in the summary radix tree (as described in Finding Free Pages section).
Since the hint may not be accurate, it may instead need to walk the radix tree to find free pages.
Note that the probability of having a N free pages decreases when N approaches 64, as the pageCache is limited to 64 pages.
In such case, there would be too many cache misses, and the runtime would have to frequently fall back to pageAlloc.find to find free pages.
That’s why if N is equal to or greater than 16, the runtime doesn’t bother checking the cache, and fallback to pageAlloc.find right away.
The diagram below summarizes the logic for finding free pages for span allocation. The gray box Find pages was described in Finding Free Pages section, the green box Grow the heap was described in Growing the heap section, while the blue box Set up a span was described in Set up a Span section.
flowchart LR
style O fill:#d6e8d5
style G fill:#a7c7e7
style P rx:20,ry:20
0((Start)) --> A
A{N < 16} --> |No|B[Acquire lock]
B --> C[Find free pages at hint address]
subgraph P[**Find pages**]
C --> D{Free pages found?}
D --> |No|F[Find free pages by walking summary radix tree]
end
D --> |Yes|E[Release lock]
F --> N{Free pages found?}
N --> |Yes|E
N --> |No|O[Grow the heap]
O --> E
E --> G[Set up a span]
A --> |Yes|H{Is P's
|
| Logic for finding free pages for span allocation |
Once new pages are acquired, they are marked as in-use in the summary radix tree to prevent other Ps from claiming them and to ensure the allocator does not reuse them on the next heap growth.
The summary radix tree hint is also updated so that subsequent allocations skip over these pages, which are in-use.
Caching Span Objects: mheap.allocMSpanLocked
As discussed in Set up a Span, an mspan object must be allocated to represent and manage a span of pages.
If an mspan object is obtained directly from mheap, it requires acquiring a global lock, which can become a performance bottleneck.
To avoid this, the Go runtime caches free mspan objects per P, just like pages.
When free pages are found in a pageCache, the runtime first checks whether the current P already has a cached mspan.
If so, it can be reused immediately without any global lock contention.
Otherwise, the runtime allocates multiple mspan objects from mheap, caches them in the P’s free list for future use, and assigns one of them to manage the newly allocated run of pages.
Central Span Manager: mcentral
Since mheap primarily manages coarse-grained units of memory such as pages and large spans, it does not provide an efficient way to allocate and free tiny or small objects.
That role is handled by mcentral, which also serves as the bridge between mheap and per-P allocators mcache (discussed in Process’s Memory Allocator).
Internal Data Structure
Each mcentral manages spans belonging to a specific span class.
In total, mheap maintains 136 mcentral instances—one for each class.
Within an mcentral, there are two categories of span sets: full (spans with no free objects) and partial (spans with some free objects).
Each category is further divided into two span sets: swept and unswept, depending on whether the spans have been swept or not.
flowchart A[mcentral] --> B[Full |
Span sets in a mcentral instance
|
What does it mean for a span to be swept? Go’s garbage collector is based on mark-and-sweep: first marking all reachable objects, then sweeping away the unreachable ones, either returning that memory to the runtime for reuse or, in some cases, releasing it back to the kernel to reduce the process footprint. Sweeping is a complex process, but in essence includes the following three steps: popping a span from the unswept set, freeing objects that have been marked as unreachable in that span, and pushing the span into the swept set.
A span transition between the partial and full is determined during allocation or sweeping, depending on whether the number of free objects in the span increases or decreases. If the number of free objects in a span reaches zero, it is moved from the partial set to the full set. Otherwise, if the number of free objects in a span is positive, it is moved from the full to the partial set.
Since span sets are thread-safe as discussed in Span Set, an mcentral can be accessed concurrently by multiple goroutines without additional locking.
Thus increases the throughput of span allocation of Go programs.
Preparing a Span: mcentral.cacheSpan
As the intermediate between mheap and mcache, an mcentral is responsible for preparing span—either existing its span sets or requested from mheap—to the requesting mcache.
To illustrate, this logic is detailed in the following flowchart.
Logic of the green box Request mheap to allocate a span was described in Span Allocation.
flowchart LR
style I fill:#d6e8d5
0((Start)) --> A[Sweep to prepare available memory for allocation if needed]
A --> B{Any span
|
Logic for preparing a span by mcentral
|
Collecting a Span: mcentral.uncacheSpan
When a mcache needs to return a span back to a mcentral, it invokes mcentral.uncacheSpan method.
If a span hasn’t been swept, it is swept first to reclaim unreachable objects.
Then regardless of whether sweeping was needed, the span is placed into either full or partial swept set, depending on its number of free objects.
Processor’s Memory Allocator: mcache
As discussed in the Go Scheduler post, each processor P serves as the execution context for goroutines.
As goroutine may allocate memory, each P also maintains its own memory allocator called mcache, which is optimized for tiny and small heap allocation, and allocating stack segment for goroutines as well.
Caching Free Spans
The name mcache comes from the fact that it caches spans with free objects for each span class in its alloc field.
When an mcache instance is initialized, every span class is cached with an emptymspan, which contains no free objects.
When a goroutine needs to allocate a user object of a specific span class, it asks mcache for a free size class object to house the requested user object—either from the cached span, or by requesting a new span from mcentral if no free object is available in the cached span.
This logic is illustrated in the following diagram.
flowchart LR
style C fill:#d6e8d5
style D fill:#b1ddf0
0((Start)) --> A{Any free size class
|
Logic for requesting a free size class object from mcache
|
Logic for the green box Return the cached span to mcentral was described in Collecting a Span.
While logic for the blue box Request mcentral for a new span was described in Preparing a Span.
Tiny Objects Allocator
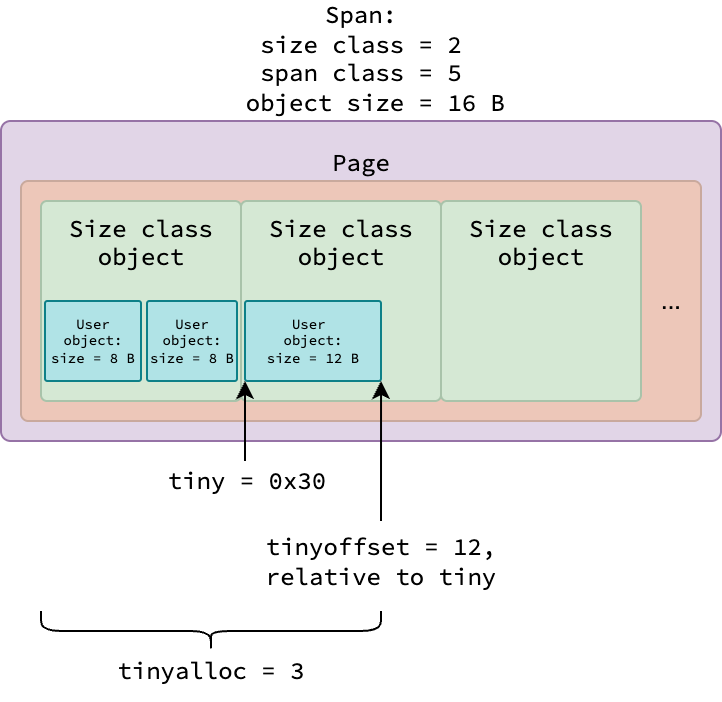
All user tiny objects of various sizes (smaller than 16 bytes) are allocated from a span class 5 (or size class 2), where each size class object occupies 16 bytes.
Each mcache instance tracks tiny allocations in a span using 3 fields:
tiny: The starting address of the current size class object having available space for allocation.tinyoffset: The end position (relative totiny) of the last allocated user object.tinyalloc: Total number of user tiny objects allocated in the current span so far.
 |
|---|
| An example span for tiny user object allocations. |
The figure above illustrates a span used for tiny object allocations, in which 0x30 is an example starting address of the size class object.
The detailed allocation logic will be explained in the Tiny Objects: mallocgcTiny.
Putting it All Together
As discussed in previous sections, Go’s memory allocator is a complex system with three components that work together to manage memory efficiently: mheap, mcentral, and mcache.
The figure below summarizes how these components interact to allocate memory for our Go programs.
Take a moment to review it before we dive into the detailed heap allocation logic in the next section.
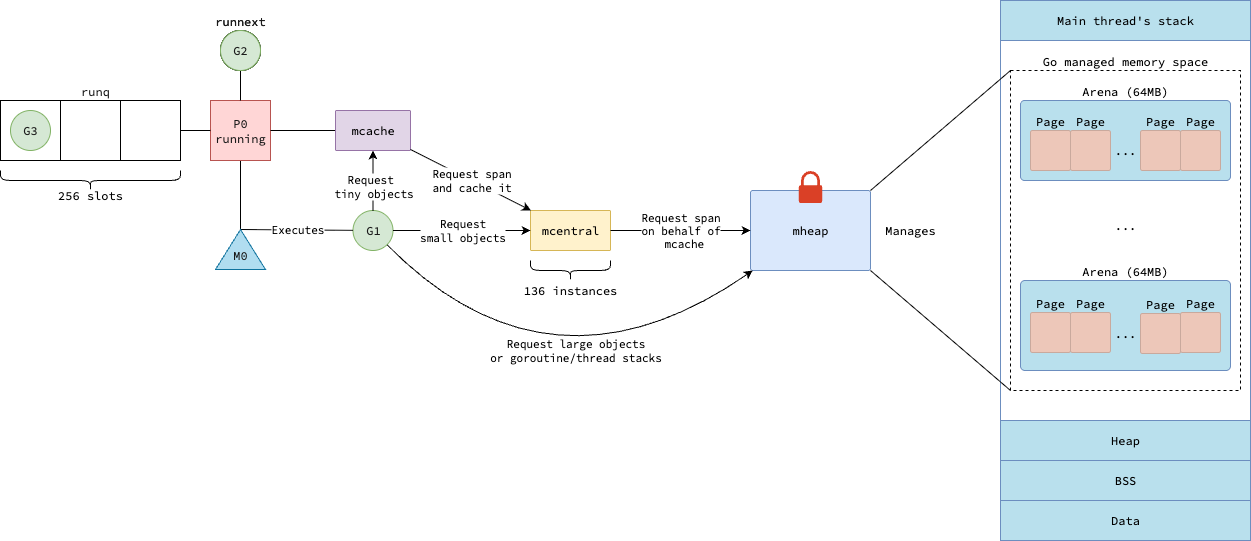 |
|---|
| Recap of memory allocator in Go |
Heap Allocation
In Go, it’s a common misconception that allocating an object on the heap requires new(T) or &T{}. This isn’t always the case for several reasons.
First, if an object is small enough, lives only within a function’s scope, and isn’t referenced outside that scope, the compiler may allocate it on the stack instead of the heap.
Second, even a primitive declared with var n int can end up on the heap, depending on escape analysis.
Third, creating composite types such as slices, maps, or channels with make often places their underlying data structures on the heap.
The decision of allocating an object on heap is determined by the compiler, and will be described in Stack or Heap? section.
This section only focuses on mallocgc—the method Go runtime uses to allocates objects on the heap.
This method will be indirectly invoked by various built-in functions and operators, such as new, make, &T{}.
mallocgc classifies objects into three categories based on their size: tiny (less than 16 bytes), small (16 bytes to 32760 bytes), and large (greater than 32760 bytes).
It also considers whether the object type contains any pointers, which affects garbage collection.
Based on these criteria, it invokes different allocation paths, as illustrated in the diagram below, to optimize memory usage and performance.
flowchart LR
A((Start)) --> B{size ≤ 32760 bytes?}
B -- Yes --> C{type doesn't contain pointer}
C -- Yes --> D{size <
|
How mallocgc determines which allocation path to take
|
Tiny Objects: mallocgcTiny
Tiny objects are allocated by an mcache in every processor P, using the three properties described in Tiny Objects Allocator section.
The allocation logic is described in the following diagram.
flowchart LR
style C fill:#b1ddf0
style G fill:#d6e8d5
A((Start)) --> B[Align mcache.tinyoffset based on the requested size]
B --> C{mcache.tinyoffset + size ≤ 16 bytes?}
C -- Yes --> D[Allocate user object at mcache.tiny + mcache.tinyoffset]
D --> K[Increase mcache.tinyoffset by requested size]
K --> M[Return the address of the allocated object]
C -- No --> E{Any free
|
Overview logic for mallocgcTiny
|
The tinyoffset is aligned based on the requested size—8-byte alignment if divisible by 8, 4-byte if divisible by 4, 2-byte if divisible by 2, and no alignment otherwise.
The check in the blue diamond means whether a requested user object of the requested size and starting at tinyoffset can fit into the current size class object; if so, it’s possible for a new user object to be allocated within that size class object.
The logic of the green box Request a new span of span class 5 from mcentral was described in Preparing a Span section.
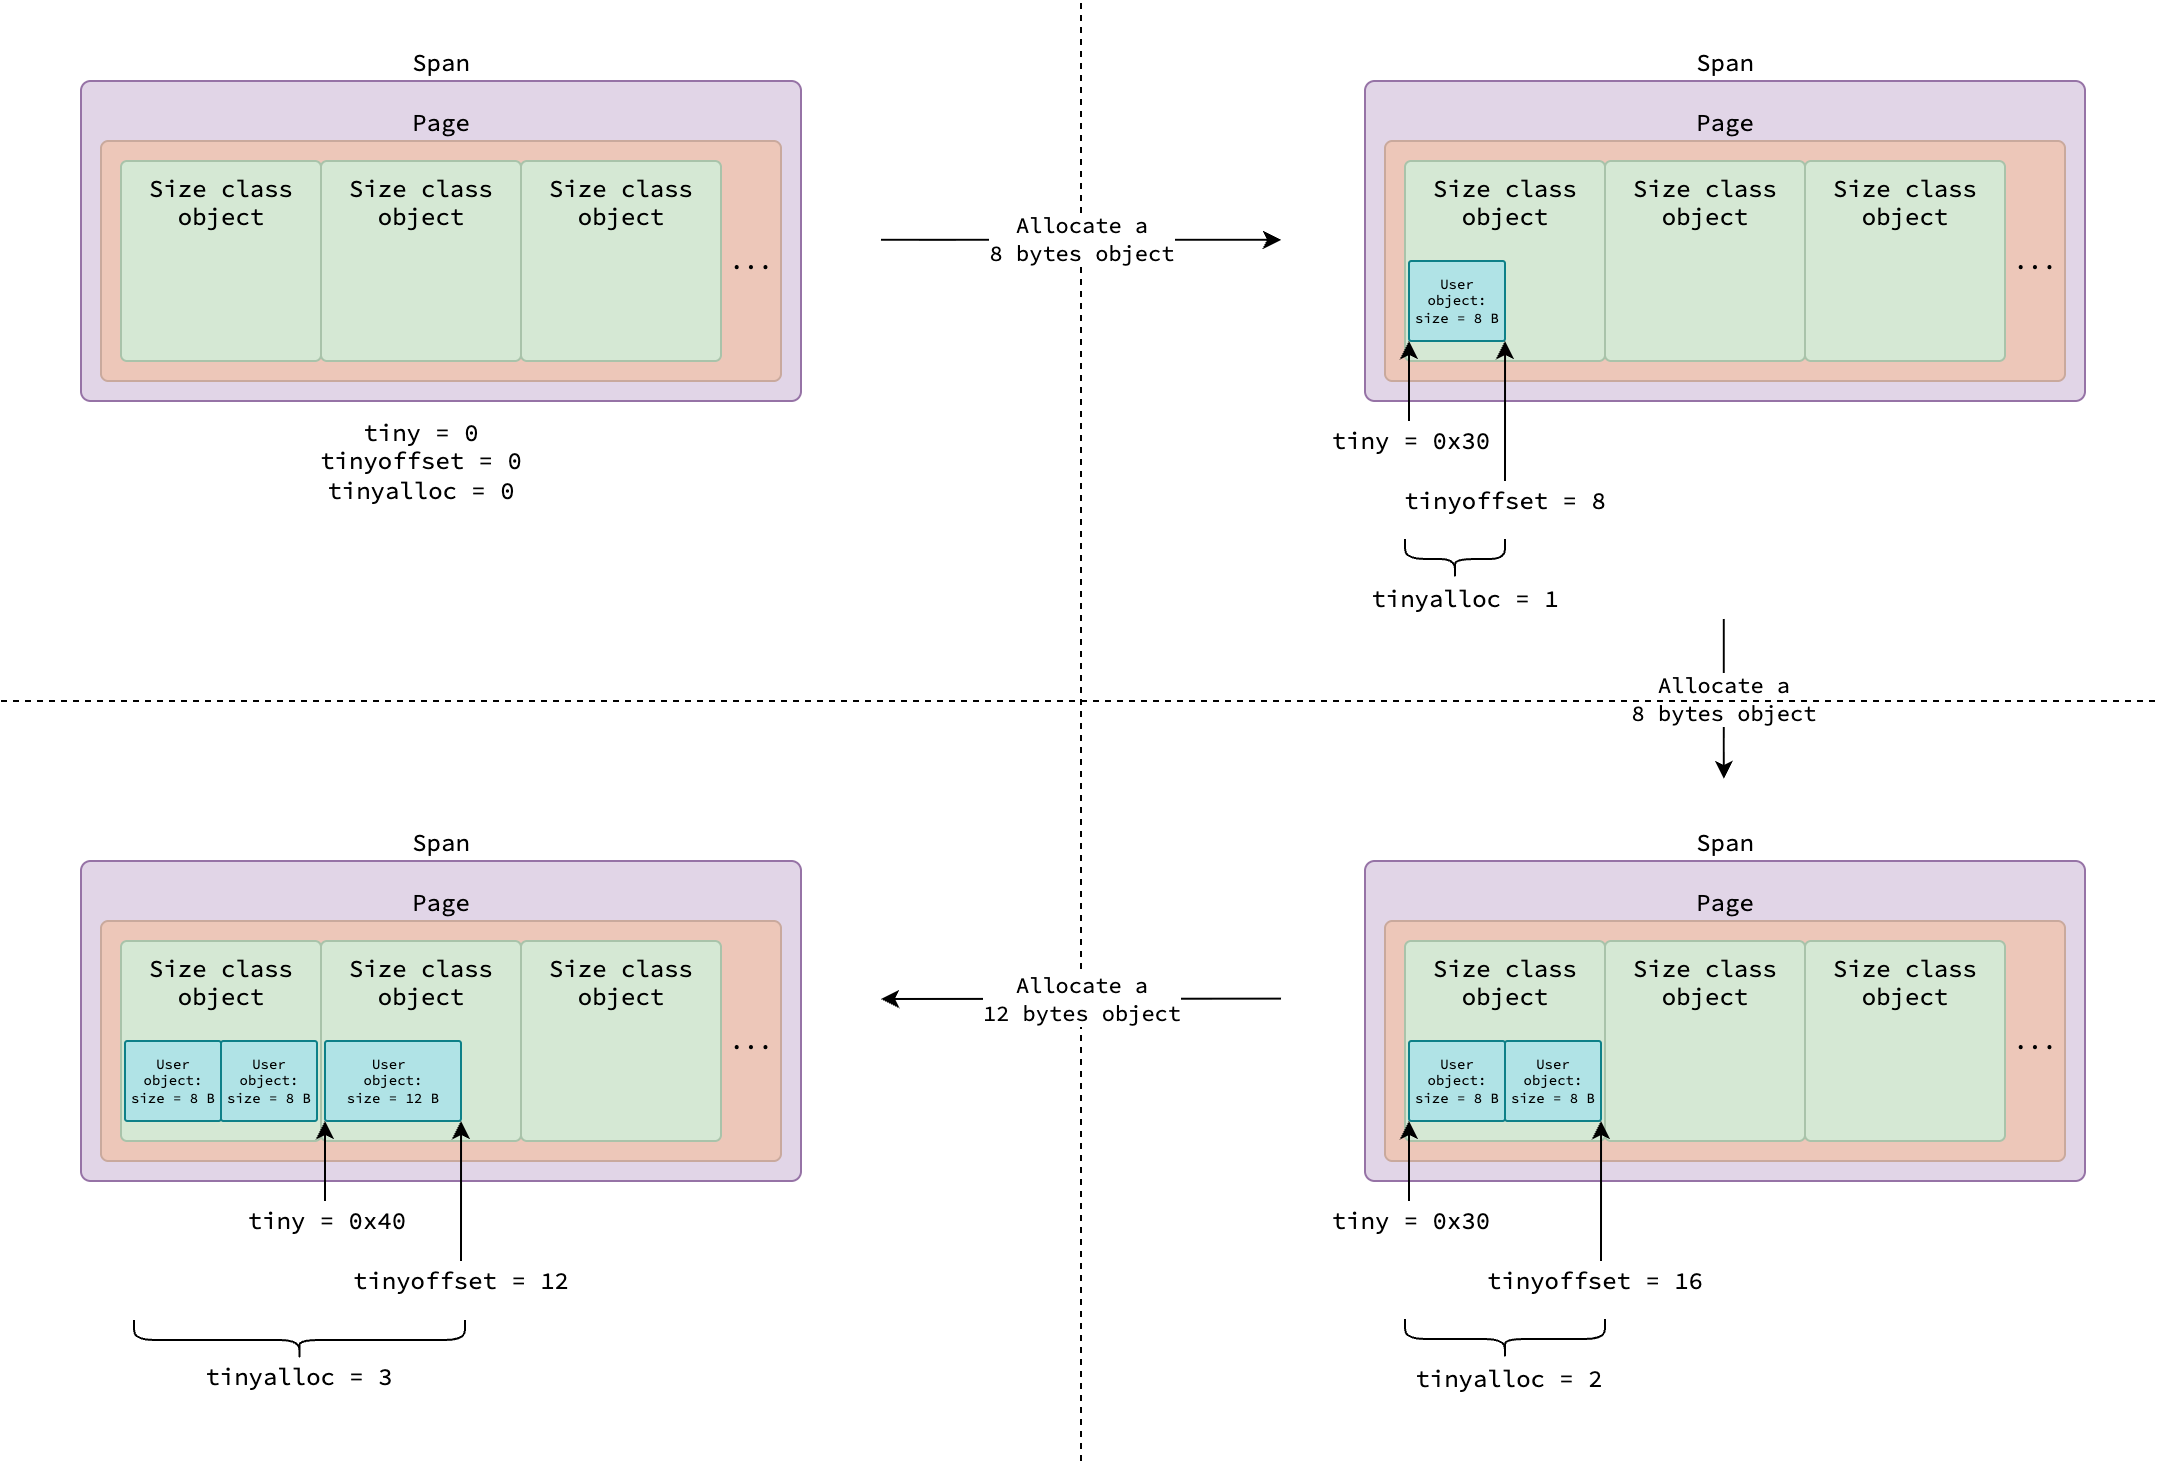 |
|---|
| Allocation for tiny objects |
Note that tiny object allocations are served by mcache, which is local to each processor P.
This makes the allocation thread-safe and lock-free, except when a new span must be requested from mheap by mcentral.
Spans used by tiny object allocations belong to span class 5, or size class 2. According to the size class table, a span of size class 2 accommodates 512 size class objects. Since each size class object can house multiple user objects in tiny allocation, a single span can serve at least 512 tiny user object allocations without any locks.
Small Objects: mallocgcSmall*
In order for the garbage collector to efficiently identify live objects and skip tracing for objects which don’t contain references to other objects, Go classifies small objects into scan and noscan span class based on whether their types contain pointers (described in Span Class section). The scan span class is further divided into two categories: those with a heap bits and those with malloc header (described in Heap Bits and Malloc Header section). Go implements different functions to allocate small objects based on these classifications.
Noscan Small Objects: mallocgcSmallNoscan
Small objects that contain no pointers are allocated by mallocgcSmallNoscan function.
The requested size is first rounded up so the object fits exactly into a size class object.
As the allocation is noscan, the span class is calculated as 2*sizeclass+1.
For example, if a user requests an object of size 365 bytes, it is rounded up to the nearest size class of 384 bytes, or size class 22.
The corresponding span class is therefore 45 (2*22+1).
The function then checks if there is a free object in the cached span of the calculated span class in the current processor P’s mcache.
If none is available, it requests a free size class object by asking for a new span from mcentral and caches it in the mcache.
After getting a free size class object, it updates information for the garbage collector and the profiler, and returns the address of the allocated object.
Scan Small Objects: mallocgcSmallScanNoHeader and mallocgcSmallScanHeader
Depending on its size, small objects containing pointers are allocated by mallocgcSmallScanNoHeader or mallocgcSmallScanHeader function.
If the requested size is less than or equal to 512 bytes, allocation is handled by the former; otherwise, it is handled by the latter.
The logic of these two functions is similar to that of mallocgcSmallNoscan, except for span class, layout of span, and layout of size class objects inside the span.
Spans used by mallocgcSmallScanNoHeader is different from ones used by mallocgcSmallNoscan—it contains a special data at its end called heap bits (see Heap Bits and Malloc Header).
Since these spans must reserve space to store heap bits, they can accommodate less size class objects than what specified in the size class table.
The reservation logic is implemented in mheap.initSpan method.
The layout of size class objects inside a span used by mallocgcSmallScanHeader is special as well—each size class object has a malloc header (see Heap Bits and Malloc Header) prepended to it.
Therefore, in order for the user object and malloc header to fit exactly into a size class object, the requested size is increased by 8 bytes before rounding up to the nearest size class.
For example, suppose Go code requests an object of 636 bytes that contains pointers.
Although this would normally fit in size class 28 (640 bytes), the fact that this object contains pointers requires a malloc header, increasing the size to 644 bytes.
This pushes the allocation into size class 29 (704 bytes).
Large Objects: mallocgcLarge
Since mcache and mcentral only manages spans of size class up to 32KB, large objects (greater than 32760 bytes) are allocated directly from mheap (see Span Allocation) without consulting mcache or mcentral.
Spans accommodating large objects can be also either scan or noscan.
Unlike small objects, large objects do not vary by span class: scan spans are always 0, and noscan spans are always 1.
When a large object is allocated, for example a slice with 1 million large structs, the kernel does not immediately commit physical memory. Instead, it reserves virtual address space for the allocation. Physical pages are only ever allocated when the program first writes to that region, thanks to demand paging.
Stack Management
As discussed in the Go Scheduler post, both Go runtime code and user code run on threads managed by the kernel. Each thread has its own stack—a contiguous block of memory that holds stack frames, which in turn store function parameters, local variables, and return addresses. Since allocating variables on the stack is simply adjusting the stack pointer (as explained in Stack Allocation), our focus is on how stacks are allocated and managed in Go.
In Go, a thread’s stack is called the system stack, while a goroutine’s stack is simply called the stack.
To manage execution contexts, the runtime introduces the m (thread) and g (goroutine) abstractions.
Every g has a stack field recording the start and end addresses of its stack.
Each m has a special g0 goroutine, whose stack represents the system stack.
The runtime uses g0 when performing operations that must run on the system stack rather than a goroutine stack, such as growing or shrinking a goroutine’s stack.
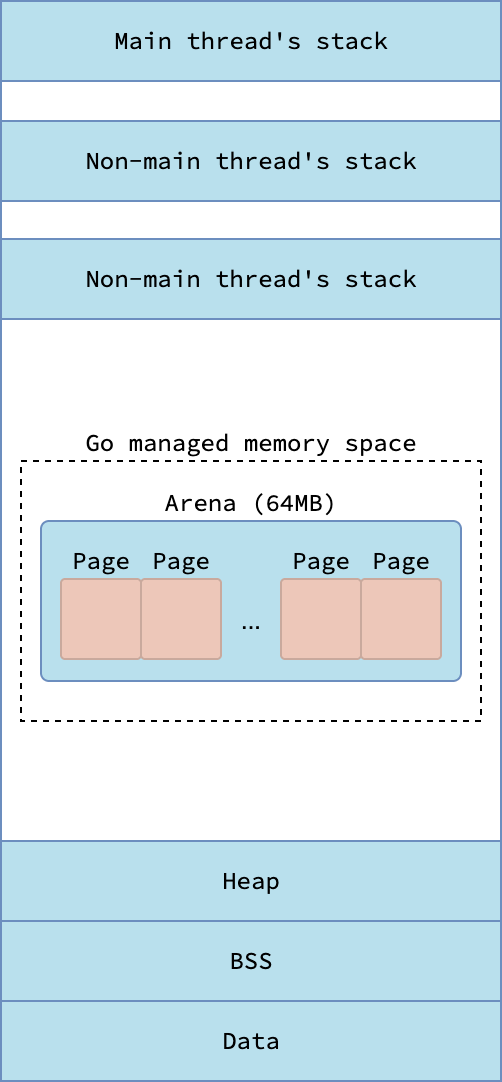
The system stack of the main thread is allocated by the kernel when a Go process starts. For non-main threads, their stack are allocated by either the kernel or the Go runtime, depending on the operating system and whether CGO is used. On Darwin and Windows, the kernel always allocates the system stack for non-main threads. On Linux, however, the Go runtime allocates a system stack for non-main threads unless CGO is used.
 |
 |
|---|---|
| Virtual memory layout of processes in Darwin/Windows | Virtual memory layout of processes in Linux |
A system stack allocated by the kernel resides outside Go’s managed virtual memory space, while a system stack allocated by the runtime is created inside it. The kernel ensures that its system stacks do not collide with Go’s managed memory. Kernel-allocated system stacks typically range from 512 KB to several MB, whereas system stacks allocated by Go are fixed at 16 KB. By contrast, goroutine stacks start with 2 KB and can grow or shrink dynamically as needed.
Allocating Stack: stackalloc
Stacks managed by the Go runtime—whether system stacks or goroutine stacks—are accommodated in spans, just like heap objects. You can think of a stack as a special kind of heap object dedicated to holding local variables and function call frames during execution of Go runtime or user code.
Stacks are normally allocated from the current P’s mcache.
If garbage collection is in progress, when the number of processors P changes, or if the current thread is detached from its P during a system call, stacks are instead allocated from the global pools.
There are two pools: small for stack smaller than 32 KB, or large pool for stacks equal to or bigger than 32 KB.
Goroutines starts wit small stack thus allocated by the small stack pool, but when it grows beyond 32 KB due to calling more functions or allocating more stack variables, the large stack pool is used instead. This behavior will be described in Stack Growth section.
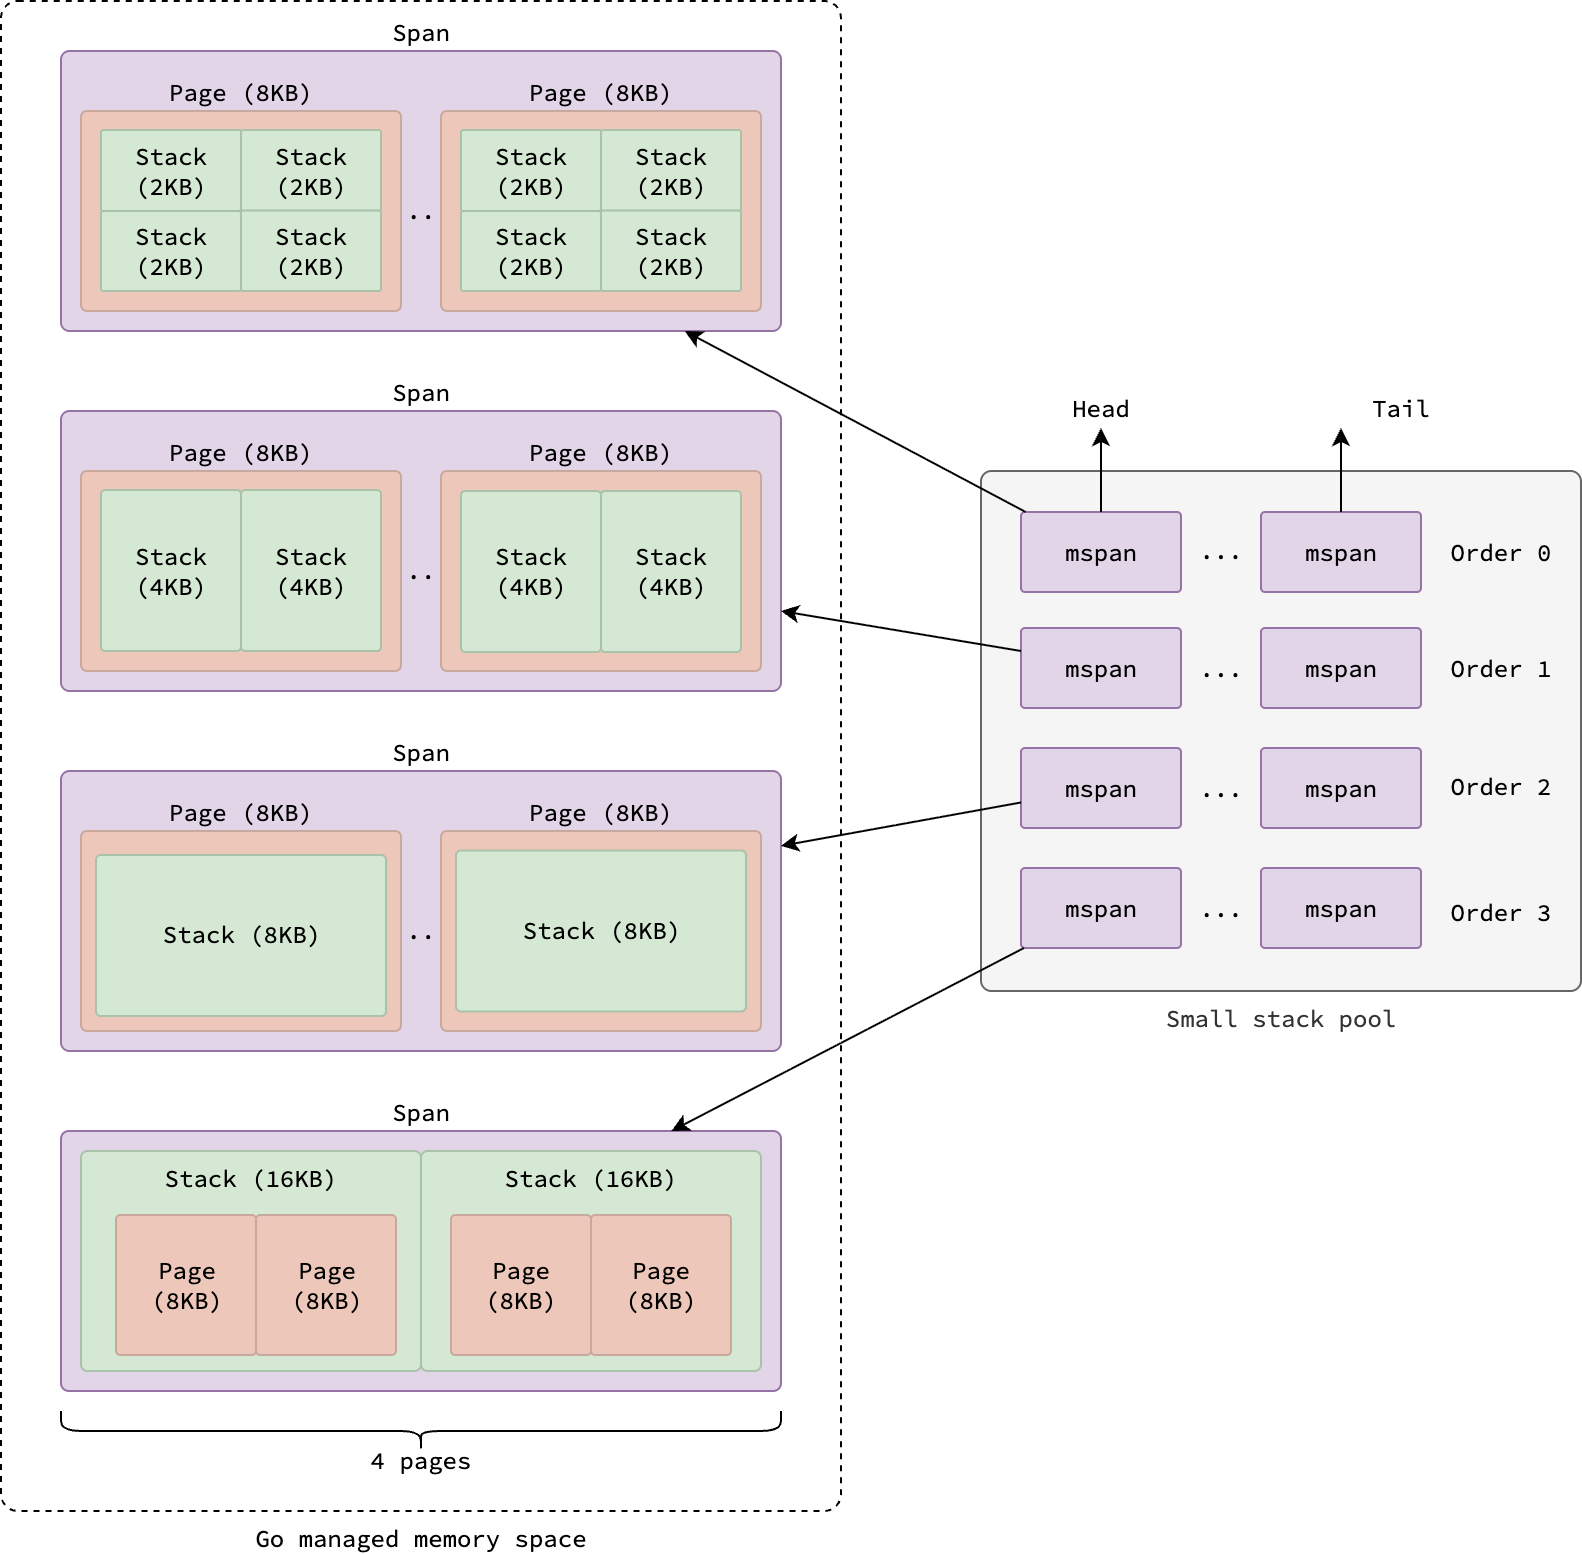
Allocating Stack from Pool
The small stack pool is a four-entry array of doubly linked lists of mspan, each span holding metadata for a block of virtual memory.
All spans in this pool belong to span class 0 and cover four contiguous pages, hence each span takes up 32 KB.
Each entry in the array corresponds to a stack order, which determines stack size: order 0 → every stack is 2 KB, order 1 → every stack is 4 KB, order 2 → every stack is 8 KB, and order 3 → every stack is 16 KB.
You might wonder why stacks are categorized into orders and sizes this way. The reason is that goroutine stacks are contiguous memory regions that double in size when they grow. This behavior will be explained in more detail in the Stack Growth section.
 |
|---|
| Pool of small stack |
When a stack smaller than 32 KB is requested, the runtime first determines the appropriate order based on the requested size.
It then checks the head of the linked list for that order to find an available span.
If no span is available, it requests one from mheap (see Span Allocation) and splits it into stacks of the required order.
Once a span is ready, Go runtime takes the first available stack, updates the span’s metadata, and returns the stack.
Large stack pool is as simple as a linked list of stack of various sizes, each stack contained within an mspan of span class 0.
When a stack equal to or larger than 32 KB is requested, the first stack is popped from the linked list and returned.
If the list is empty, it requests a new span from mheap (see Span Allocation).
Note that since stack pools are global, and can be accessed by multiple threads concurrently Therefore, they are protected by a mutex lock to ensure thread safety with the trade-off of lower throughput due to lock contention.
Allocating Stack from Cache
In order to reduce lock contention when allocating stack, each processor P maintains its owns stack cache in its mcache.
Similar to small stack pool, the stack cache is a four-entry array of singly linked lists of free stacks, each entry corresponding to a stack order.
When serving a small stack allocation request, the runtime first checks the stack cache of the current P for an available stack.
If none is available, it refills the cache by requests some stacks from the small stack pool, caches them, and return the first one.
Large stacks aren’t served from the stack cache, they are always allocated from the large stack pool directly.
Stack Growth: morestack
Segmented Stack
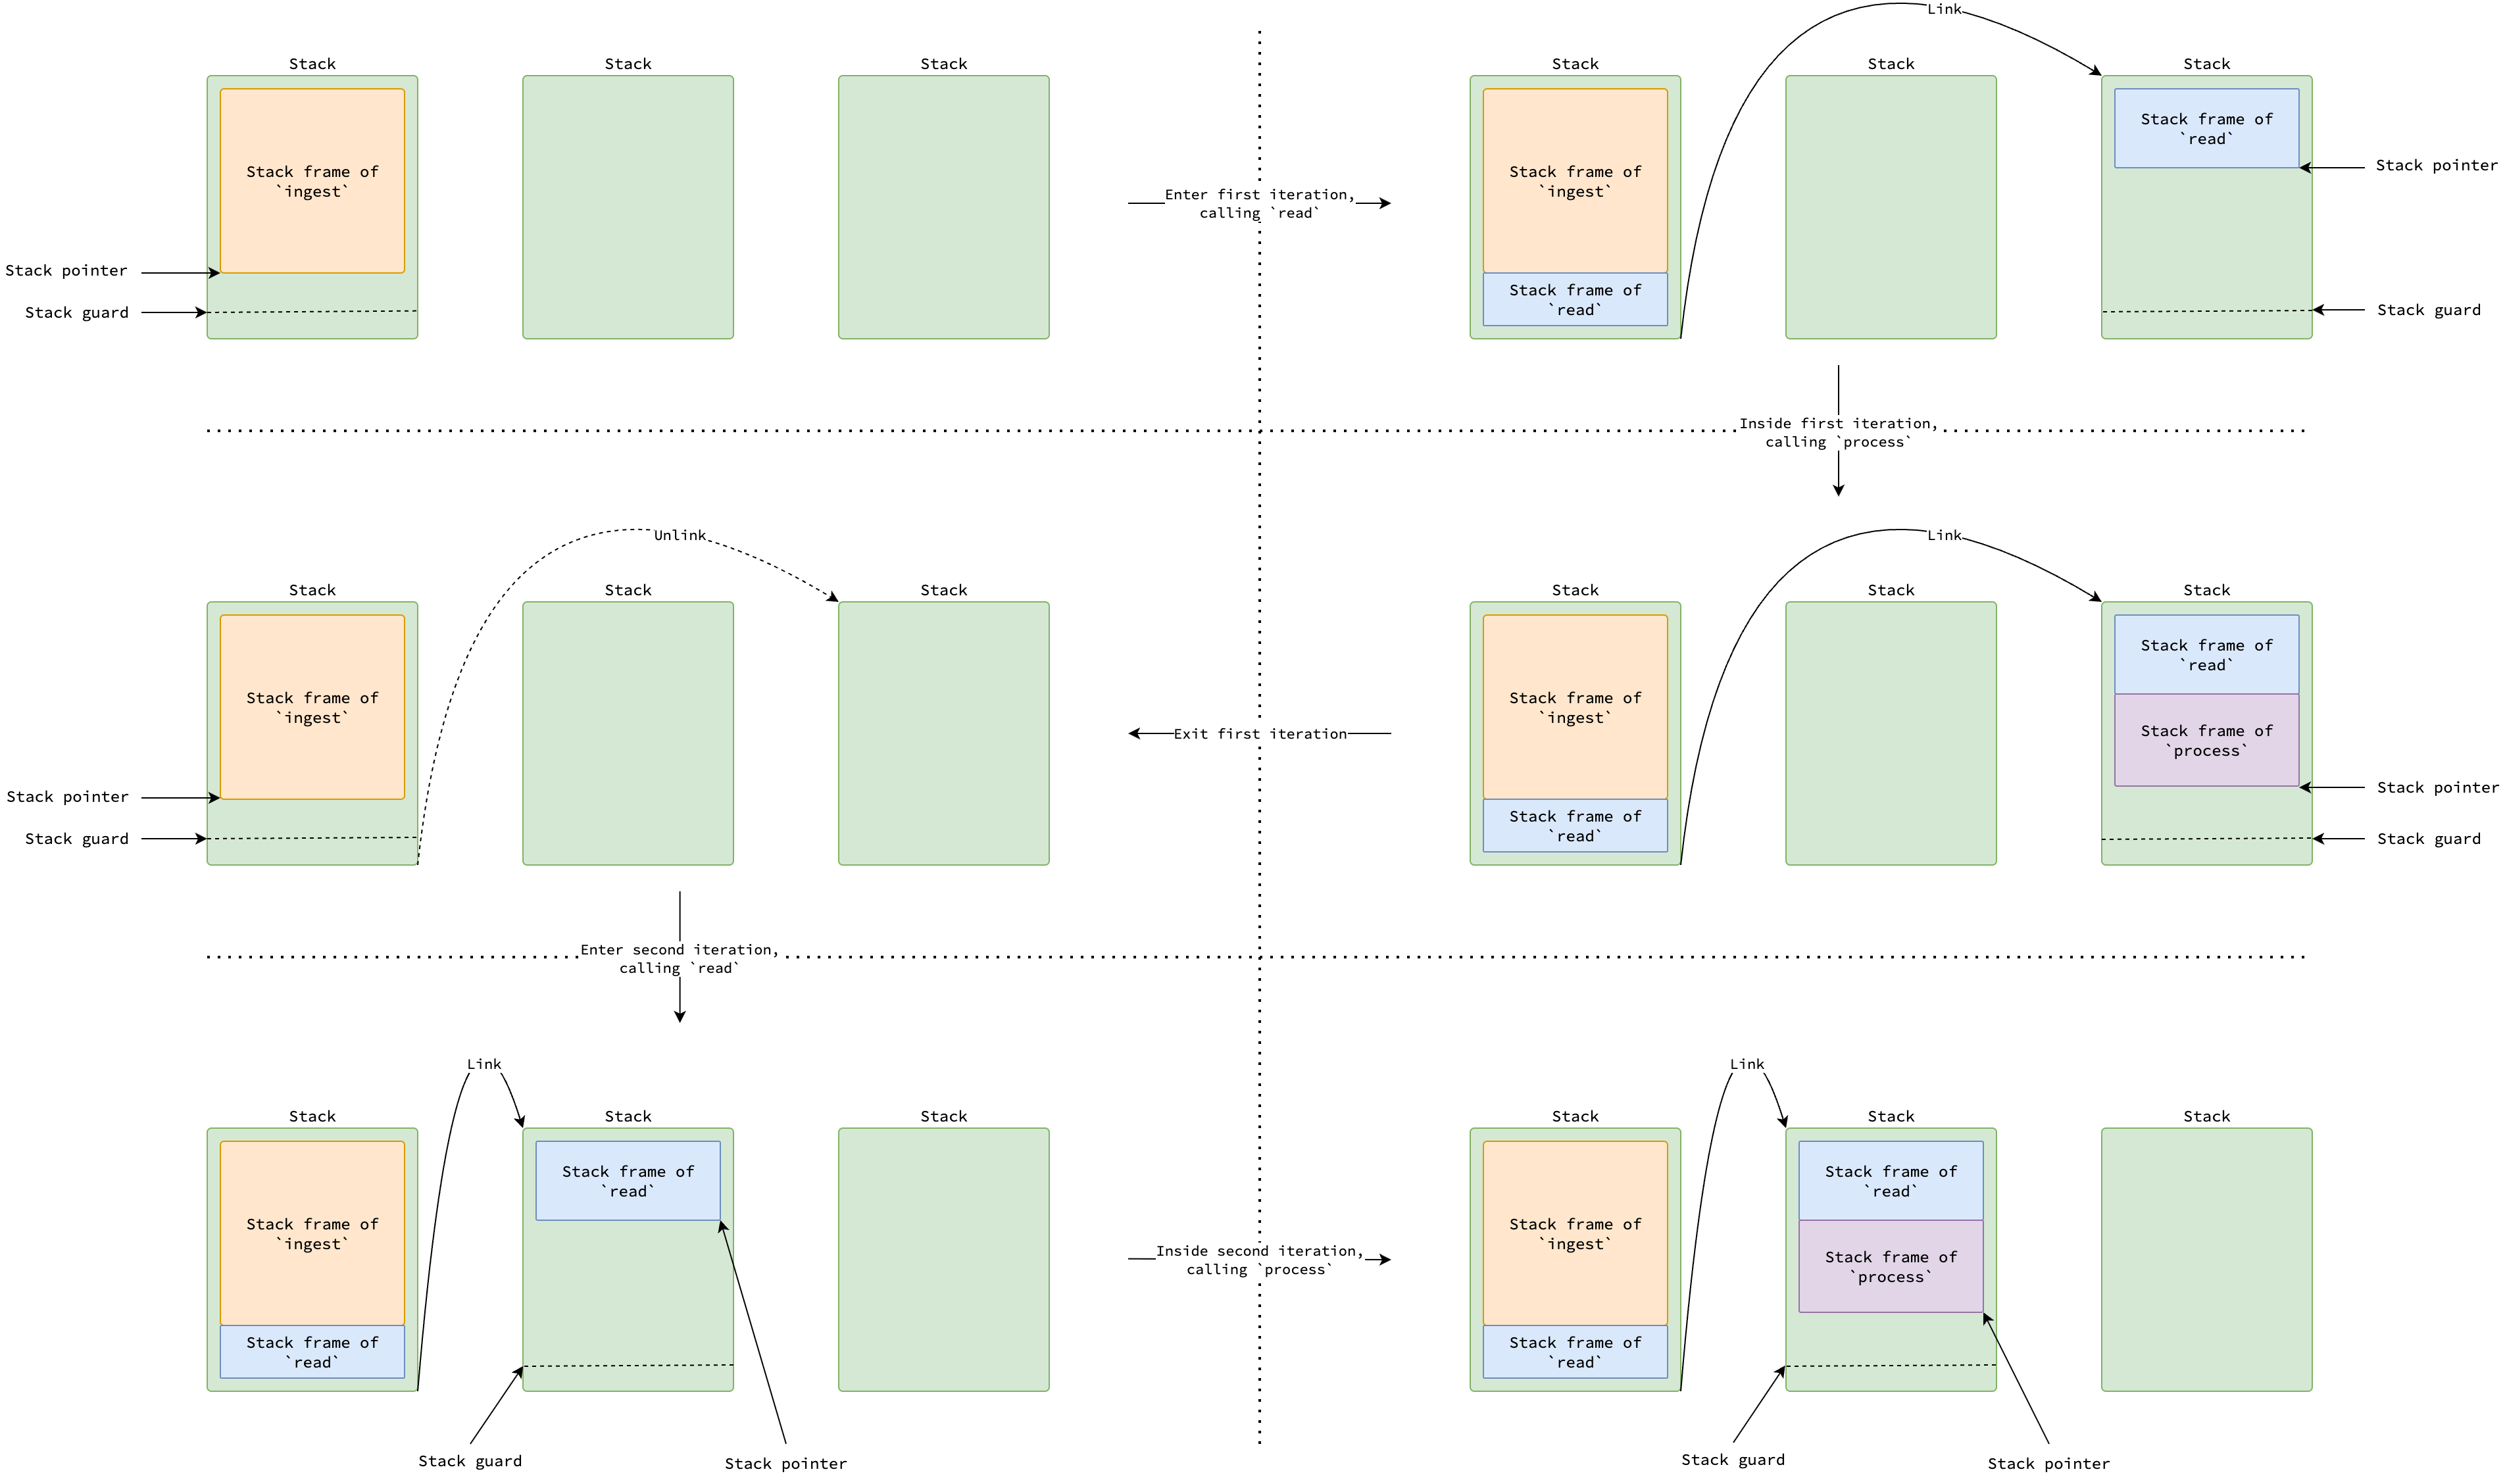
Historically, Go used a segmented stack approach. Each goroutine started with a small stack. If a function call required more stack space than available in the current stack, a new, another stack would be allocated and linked to the previous one. When the function returned, the new stack would be deallocated, and execution would continue on the previous stack. This process was known as a stack split.
The below code snippet and figure illustrate a scenario where the ingest function process data from a file line by line, where stack frame of read scatters across two stacks.
If the stack pointer reach some limit (the so-called stack guard, which will be discussed later), calls to read or process may trigger a stack split.
Please note that goroutine stack may not consist of contiguous memory regions in this approach.
func ingest(path string) {
  ...
  for {
    line, err := read(file) // Causes stack split.
    if err == io.EOF {
      break
    }
    process(line)
  }
  ...
}
 |
|---|
| Stack split in segmented stack strategy |
However, this segmented stack approach had a performance issue known as the hot stack split problem. If a function repeatedly need frequent allocation and deallocation of stacks within a tight loop, the entire process would incur a significant performance penalty. When the function returns, the newly allocated stack are deallocated. Since each stack split takes 60 nanosecond, the issue leads to significant overhead as it happens for every iteration of the loop.
One trick to avoid this issue is to add padding to the stack frame of functions that are called frequently within loops. We can allocate dummy local variables to increase the stack frame size, thus reducing the likelihood of stack splits. But from the perspective of Go programmers, this is error-prone and reduces code readability.
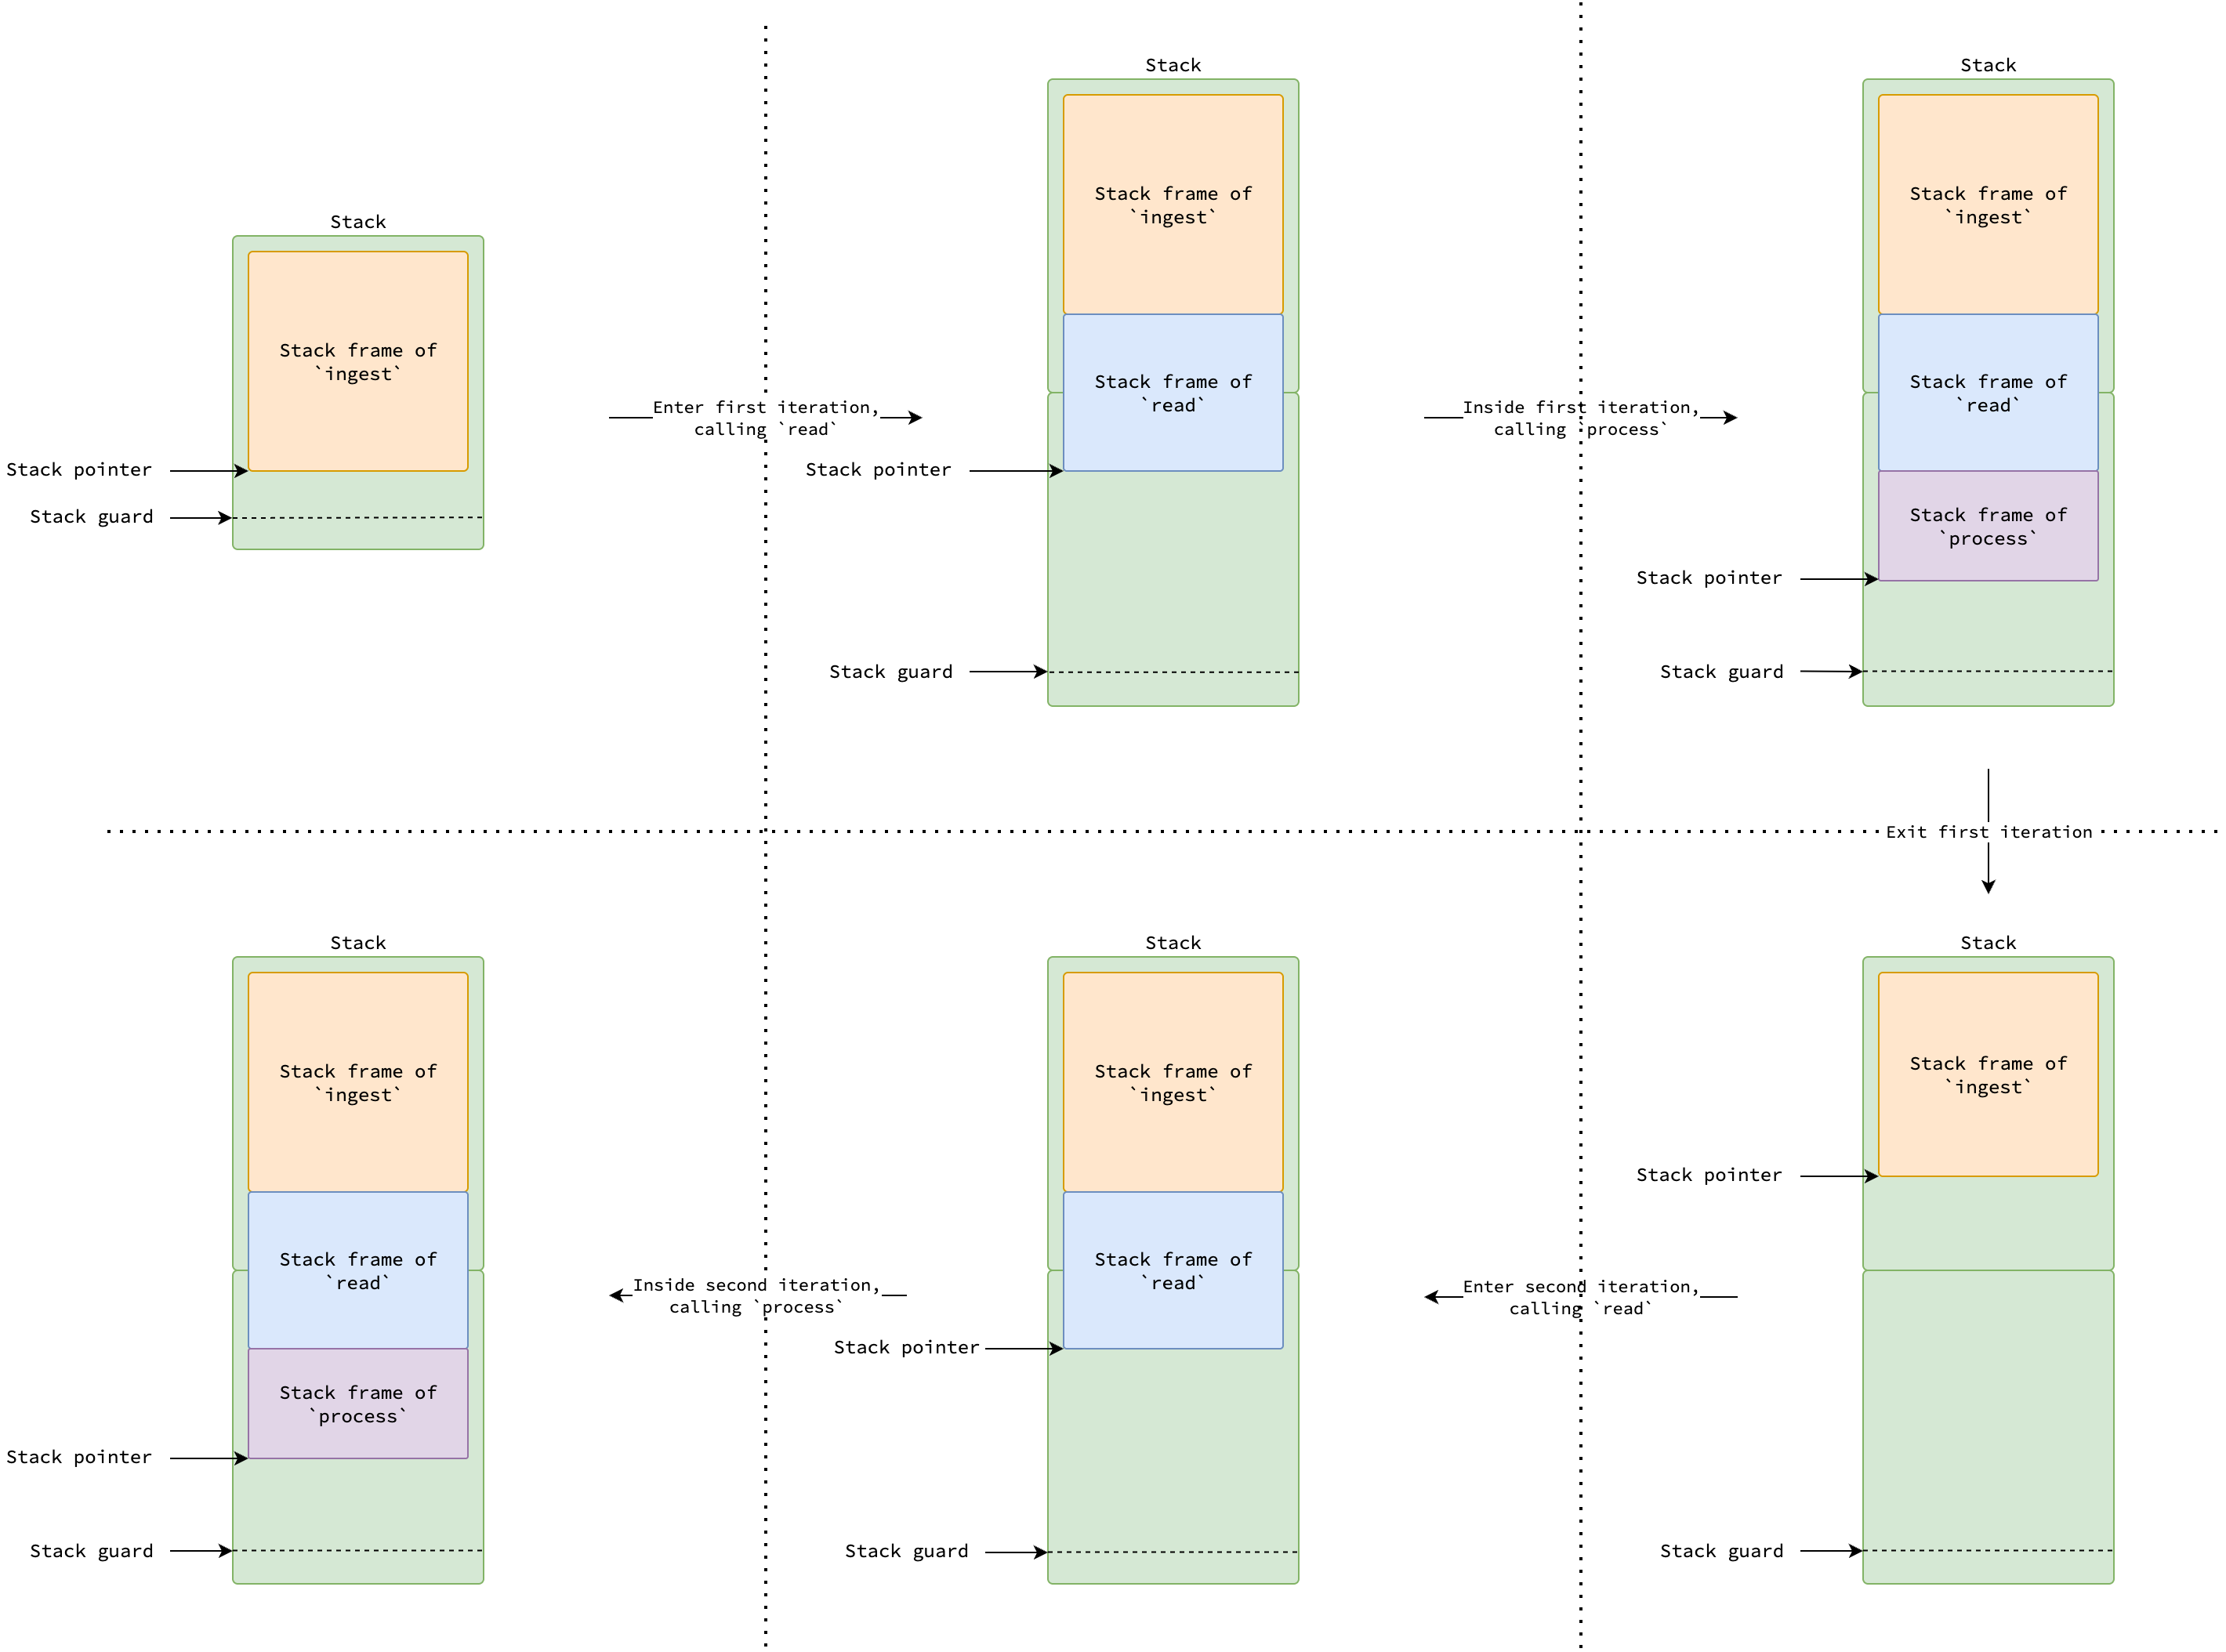
Contiguous Stack
To mitigate the hot stack split problem, Go after version 1.4 switches to an approach so-called contiguous stacks. When goroutine stack needs to grow, a new larger stack twice bigger than the current one is allocated. The content of the current stack is copied to the new stack, and the goroutine switches to use the new stack.
 |
|---|
| Copy stack in contiguous stack strategy |
The figure above illustrates a contiguous stack and shows that it is not shrunk when underutilized (e.g., after the first iteration completes). This behavior helps mitigate the hot-split problem.
If goroutine stacks were never shrunk, however, memory can be wasted if it grows significantly during peak usage but later leaves most of that space unused.
In fact, with contiguous stack scheme, a goroutine stack is shrunk during a garbage collector cycle rather than when a function returns.
If the total in-used stack size is less than a quarter of the current stack size, a new smaller stack half the size of the current one is allocated.
Content of the current stack is copied to the new stack, and the goroutine switches to use the new stack.
See shrinkstack for more details.
As mentioned in the Go Scheduler post, in order for goroutine stack to grow, some checks must be inserted at function prologues.
The check is basically CPU instruction and costs CPU cycles to execute.
For small functions that are called frequently, this overhead can be significant.
To mitigate this overhead, small functions are marked with //go:nosplit directive, which tells the compiler not to insert stack growth checks in their prologues.
⚠️ Don’t be confused. Split in
//go:nosplitsounds relate to stack split in segmented stack approach, but it actually means stack growth check in contiguous stack approach as well.
Stack Guard
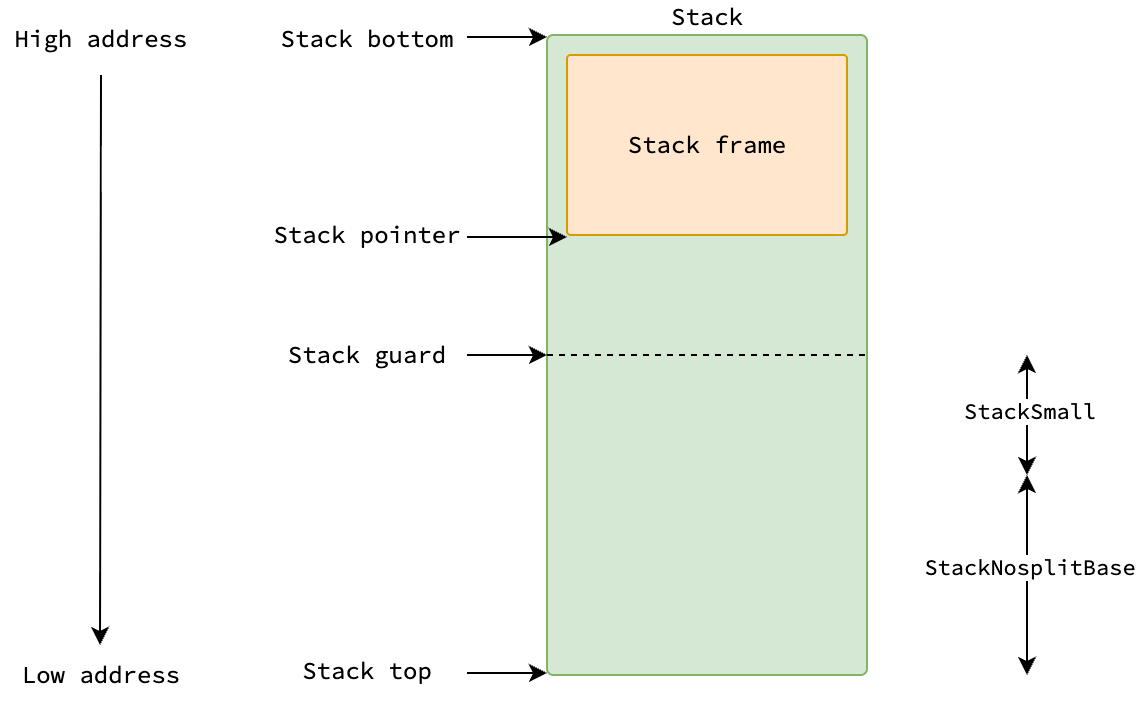
When a function is called, the stack pointer is decreased by the size of the function’s stack frame.
It is then checked against the goroutine’s stack guard, which determines whether stack growth is required.
The stack guard consists of two parts: StackNosplitBase and StackSmall.
On Linux, this places the guard at 928 bytes above the stack bottom—800 bytes for StackNosplitBase and 128 bytes for StackSmall.
 |
|---|
| The position of stack guard in a goroutine stack |
But overflow means that stack pointer goes beyond the stack, so why is the stack pointer checked against the stack guard rather than the bottom of the stack? The reasons are explained in this comment in the Go runtime source code. Let me re-explain them in simpler terms.
First, since Go allows functions not to perform stack grow checks by marking them with //go:nosplit, space equal to StackNosplitBase must be reserved so that they can execute safely without referencing any invalid address.
For example, morestack—which itself handles stack growth—must have its entire stack frame fit within the allocated stack.
Second, it serves as an optimization for small functions having stack frame smaller than StackSmall.
When these functions are called, Go doesn’t bother decreasing the stack pointer and checking it against the stack guard.
Instead, it simply checks whether the current stack pointer is below the stack guard, saving one CPU instruction per function call by skipping the stack pointer adjustment.
Reusing Stack: stackfree
When goroutine finishes its execution, goroutine stack is shrunk due to having too much available space, or system thread managed by Go runtime exits, their stacks are marked as reusable.
If the goroutine is currently attached with a processor P and the size of P’s stack cache is small enough, its stack is returned to the stack cache of that P.
Otherwise, the stack is returned to the global pool—either small stack pool with the corresponding order or large stack pool, depending on the size of the stack.
When stack is returned to the global pool, the corresponding page of memory will be returned to kernel if garbage collection is not in progress. Check this comment in the Go runtime source code for more details.
Stack or Heap?
One may think that var n T always allocates it on the stack, and new(T) or &T{} always allocates an object of type T on the heap.
But that’s not always the case in Go. Let’s examine some hypothetical examples to get the problem behind and how Go addresses them.
Consider the following program which defines a function getUserByID that retrieves a user their identifier.
Hypothetically, getUserByID allocates a User struct on the stack, fetches user data from a database, and returns the address of that struct, aka. returning the pointer to that struct.
func getUserByID(id int64) *User {
  var user User
  user = db.FindUserByID(id)
  return &user
}

func main() {
  var userID int64 = 1
  var user *User = getUserByID(userID)
  var userAge = user.age
  user.age = userAge + 1
}
 |
|---|
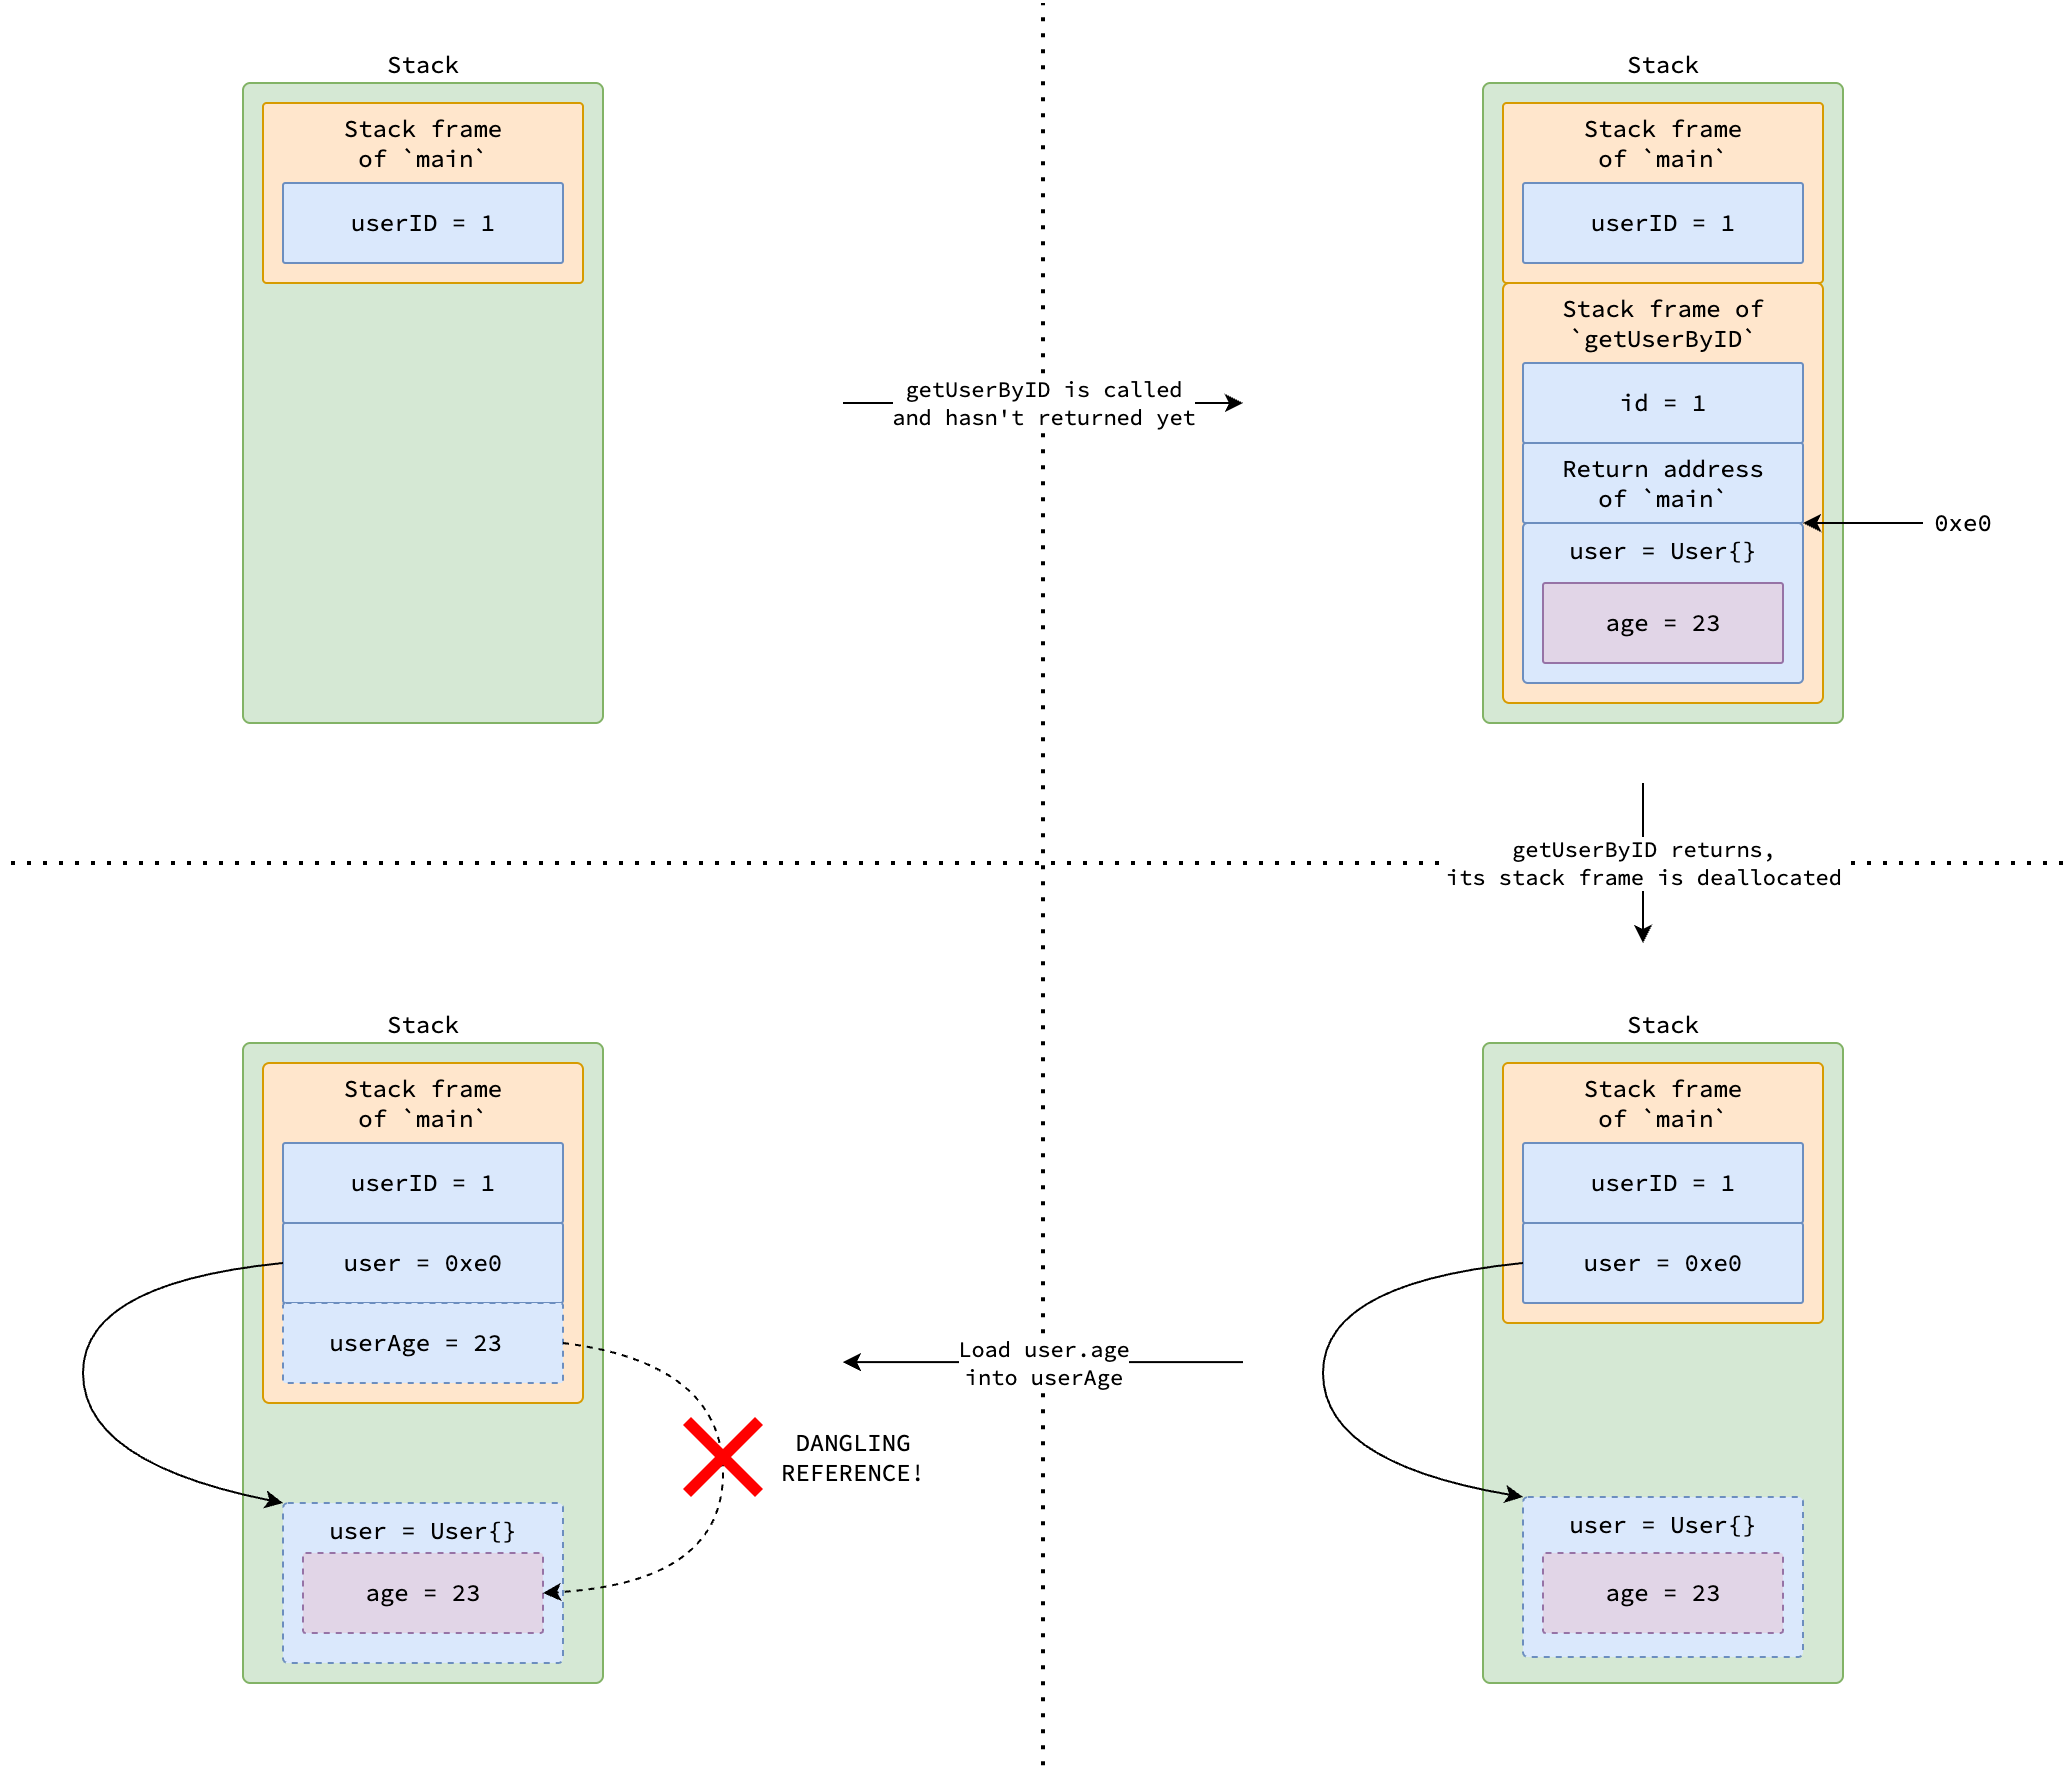
| Dangling pointer problem |
When getUserByID is called, the user variable is placed at address 0xe0 in its stack frame.
After the function returns, user still holds the address 0xe0, but that address is no longer valid because the stack frame of getUserByID has been popped.
When main then tries to access user.age, it dereferences an invalid address, leading to a dangling pointer problem and undefined behavior.
To prevent such issues, Go employs a technique called escape analysis, which happens during compile time.
Escape analysis determines whether a variable—declared with var n T, new(T), &T{}, or make(T)—could be safely allocated on goroutine stack or must escape to the heap.
If a variable is recognized to be referenced outside its declaring function, it is allocated on the heap to ensure it can be safely accessed after the function returns.
In the above code snippet, the user variable is determined to escape to the heap because its address is returned and used in main.
Therefore, the compiler allocates user on the heap to prevent dangling pointer issues.
Escape analysis also attempts to keep variables on the stack, even if they would normally be heap-allocated (e.g., those created with new(T), &T{}, or make(T) keywords), as long as they are proven to be used only within the function scope and do not take more memory space than MaxImplicitStackVarSize at compile time.
You can verify these behaviors by compiling the following program with the -gcflags="-m" option, which instructs the compiler to print optimization decisions, including escape analysis results.
package main

type User struct { ID int64 }

func newUser(id int64) *User {
  user := User{ID: id}
  return &user
}

func main() {
  _ = newUser(20250603)
  _ = make([]User, 100)
}

// $ go build -gcflags="-m" main.go
// ./main.go:6:2: moved to heap: user
// ./main.go:12:10: make([]User, 100) does not escape
We can see that user is moved to the heap because it escapes, while the slice created by make([]User, 100) doesn’t escape because it’s used only in main and its size is less than MaxImplicitStackVarSize.
Now, try updating the length of the slice to 1,000,000 and compile the program again with the same option and observe the output below.
user still escapes to the heap, but this time the slice created with make([]User, 1000000) also escapes because its size exceeds MaxImplicitStackVarSize, thus too large to fit on stack.
// $ go build -gcflags="-m" main.go
// ./main.go:6:2: moved to heap: user
// ./main.go:12:10: make([]User, 1000000) escapes to heap
Case Studies
As you have a better understanding of how Go allocates memory for heap objects and stacks, let’s examine some real-world examples to understand how Go allocates memory in practice and how to optimize heap allocations.
Case Study 1: Reusing Underlying Array of Slice
As you may know that a slice in Go is a descriptor containing a pointer to an underlying array, its length, and its capacity.
When we create a new slice with make([]T, length, capacity), the compiler overwrites the make keyword with a call to makeslice in the Go runtime.
makeslice then calls mallocgc with the size equal to capacity*sizeof(T) to allocate the underlying array on the heap.
In other words, capacity tracks the size of the underlying array, while length tracks the number of in-use elements in the array.
append appends new elements to the end of the slice, increasing its length.
If the new length exceeds the current capacity, append calls mallocgc to allocate a new underlying array twice as big, copies the existing elements to the new array, and updates the slice descriptor to point to the new array.
A slice in Go can be resliced using the [start:end] syntax.
Reslicing creates a new slice header that points to a subrange of elements within the same underlying array as the original slice.
Importantly, this operation does not copy the data or allocate additional memory—the new slice simply reuses the existing array.
See more at Slice Intro.
We can leverage the reslicing behavior to optimize heap allocations by reusing the underlying array of a slice instead of creating a new one. Consider the following program that parses a CSV file processes each row one by one, where each row can have a large number of fields.
package main

import (
  "bufio"
  "os"
)

func parse(line string) []string {
  start := 0
  var row []string
  for i := 0; i < len(line); i++ {
    if line[i] == ',' {
      row = append(row, line[start:i])
      start = i + 1
    }
  }
  row = append(row, line[start:])
  return row
}

func process(row []string) {
  // Process the line.
}

func main() {
  file, _ := os.Open("input.csv")
  defer file.Close()

  scanner := bufio.NewScanner(file)
  for scanner.Scan() {
    line := scanner.Text()
    row := parse(line)
    process(row)
  }
}
Since parse creates an empty slice for each line, it allocates a new underlying array on the heap every time it is called.
Plus, since append is called for each field in the line, it may trigger multiple heap allocations if the number of fields exceeds the initial capacity of the underlying array.
The same path in mallocgc is executed repeatedly, leading to many wasteful heap allocations.
Let’s optimize the program by reusing the underlying array of the row slice.
By reslicing with row[:0], we reset the length of the slice to zero while keeping its capacity unchanged.
Heap allocations only occur in the first call to parse, i.e. when the first line is parsed.
For a CSV file having 1,024 fields and 1,000,000 lines, the number of heap allocations is reduced from 1000000*log₂(1024)=10⁷ to just log₂(1024)=10 simply by reslicing.
package main

import (
  "bufio"
  "os"
)

func parse(line string, row []string) []string {
  start := 0
  for i := 0; i < len(line); i++ {
    if line[i] == ',' {
      row = append(row, line[start:i])
      start = i + 1
    }
  }
  row = append(row, line[start:])
  return row
}

func process(row []string) {
  // Process the line.
}

func main() {
  file, _ := os.Open("input.csv")
  defer file.Close()

  var row []string
  scanner := bufio.NewScanner(file)
  for scanner.Scan() {
    line := scanner.Text()
    row = row[:0] // Reuse the underlying array.
    row = parse(line, row)
    process(row)
  }
}
Case Study 2: Grouping Multiple Variables into a Single Struct
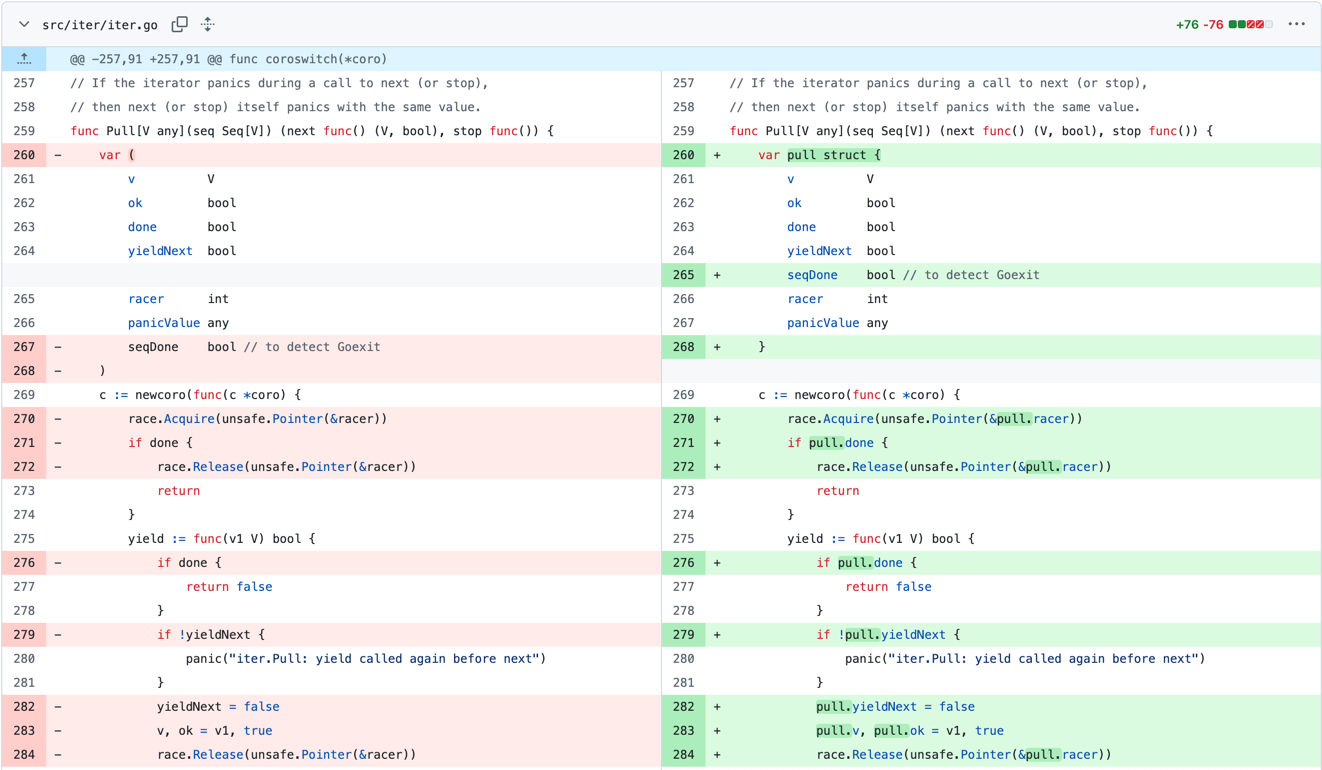
Recently, there was a commit in the iter package that grouped multiple scalar variables into a single struct.
 |
|---|
| Change that groups multiple variable declarations into one struct declaration |
Originally, since these 7 variables outlive the function scope, all of them are allocated on the heap separately, thus results in 7 calls to mallocgc.
Although some of these variables are smaller than 16 bytes and can be allocated by the Tiny Objects Allocator, the overhead of 7 calls to mallocgc is still significant if Pull is called frequently.
By grouping these variables into a single struct, only one call to mallocgc is needed to allocate the struct on the heap, improving memory allocation efficiency.
This approaches has a downside, however, that it couples unrelated objects together, which prevents the garbage collector from reclaiming individual objects that are no longer needed.
However, in this specific case, since most of these variables are used together, the trade-off is acceptable.
The benchmark results in the original PR (copied below) show that the number of heap allocations is reduced from 11 to 5.
The difference matches the above analysis, where 7 variables are grouped into a single struct, thus saving 6 calls to mallocgc.
Also, the memory consumption and allocation time are reduced by around one-third.
         │ /tmp/bench.old │           /tmp/bench.new           │
         │     sec/op     │   sec/op     vs base               │
Pull-12       218.6n ± 7%   146.1n ± 0%  -33.19% (p=0.000 n=10)

         │ /tmp/bench.old │           /tmp/bench.new           │
         │      B/op      │    B/op     vs base                │
Pull-12        288.0 ± 0%   176.0 ± 0%  -38.89% (p=0.000 n=10)

         │ /tmp/bench.old │           /tmp/bench.new           │
         │   allocs/op    │ allocs/op   vs base                │
Pull-12       11.000 ± 0%   5.000 ± 0%  -54.55% (p=0.000 n=10)
Case Study 3: Reusing Objects with sync.Pool
In some applications, many short-lived, stateless objects of the same type are created and discarded frequently.
A typical example is the pp printer object, which is used extensively throughout the fmt package to format strings in commonly used functions, such as Fprintf and Sprintf.
If these functions allocated a new pp object, used it to perform formatting, and then throws it away then when your application writes 10,000 logs per second, translating into 10,000 pp objects being allocated and later scanned by the garbage collector every second.
This pattern leads to significant overhead due to frequent heap allocations and garbage collection.
To reduce this overhead, Go provides sync.Pool, a mechanism for caching and reusing objects of the same type.
When handling a Get request, sync.Pool first looks for an available object in its pool.
If none is found, it invokes a user-defined New function to create one, which ultimately calls mallocgc to allocate it on the heap.
Once the client is done with the object, it can be returned to the pool using the Put method.
By recycling objects, sync.Pool reduces both the number of heap allocations and the number of objects the garbage collector needs to scan, thereby improving performance.
In reality, Fprintf and Sprintf requests a pp from the pool, uses it for formatting, and then returns it to the pool for future reuse.
The ppFree pool is initialized when the fmt package is imported.
sync.Pool is designed to be lock-free and efficient under high concurrency.
To achieve this, it relies on a technique called pinning, which prevents a goroutine from being preempted while getting or putting an object in the pool.
Since a sync.Pool is local to each processor P, pinning ensures that the goroutine remains on the same P during the operation.
Conclusion
Go’s memory allocator is designed with a clear goal in mind: to provide efficient in highly concurrent applications.
By layering its allocation strategy across mheap, mcentral, and mcache, the runtime balances global coordination with per-P caching, minimizing lock contention while keeping allocations fast.
Stacks, though managed differently from heap objects, follow similar principles of efficient allocation and adaptive growth.
For most Go developers, these details remain hidden behind simple constructs such as &T{}, new(T), and make(T).
Yet, understanding the internals provides valuable insight into why certain patterns perform better than others, how the garbage collector interacts with allocation, and what trade-offs the runtime makes to achieve low-latency concurrency at scale.
As you build and optimize Go applications, keep in mind that every variable or goroutine you create is ultimately backed by these mechanisms.
I hope you find this knowledge useful for writing more efficient and reliable Go programs.
If you have any concerns, feel free to leave a comment.
If you really enjoyed my content, please consider
 ! 😄
! 😄
References
- Ankur Anand. A Visual Guide to Go Memory Allocator.
- sobyte.net. Go Memory Allocation, Go Stack Management.
- Michael Knyszek, Austin Clements. Scaling the Go Page Allocator.
- Dmitry Vyukov. Go Scheduler: Implementing Language with Lightweight Concurrency.